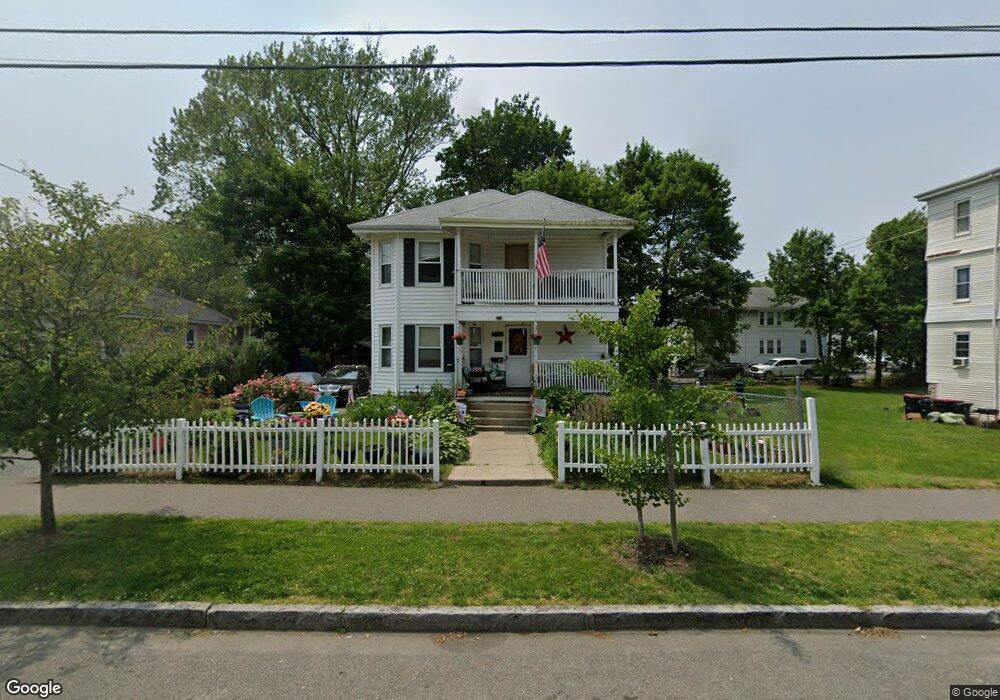
9 Bouve Ave Brockton, MA 02301
Clifton Heights NeighborhoodEstimated Value: $627,217 - $740,000
4
Beds
2
Baths
2,236
Sq Ft
$307/Sq Ft
Est. Value
About This Home
This home is located at 9 Bouve Ave, Brockton, MA 02301 and is currently estimated at $685,804, approximately $306 per square foot. 9 Bouve Ave is a home located in Plymouth County with nearby schools including Gilmore Elementary School, John F. Kennedy Elementary School, and Davis K-8 School.
Ownership History
Date
Name
Owned For
Owner Type
Purchase Details
Closed on
Jul 9, 2025
Sold by
Contreras Edgar R Est and Vasquez
Bought by
Vasquez Blanca and Vasquez Mario
Current Estimated Value
Home Financials for this Owner
Home Financials are based on the most recent Mortgage that was taken out on this home.
Original Mortgage
$145,000
Outstanding Balance
$144,510
Interest Rate
6.89%
Mortgage Type
New Conventional
Estimated Equity
$541,294
Purchase Details
Closed on
Oct 29, 1999
Sold by
Cardoso Miguel S
Bought by
Contreras Edgar R
Purchase Details
Closed on
Jul 11, 1996
Sold by
Fonseca Francisco P
Bought by
Cardoso Miguel S
Create a Home Valuation Report for This Property
The Home Valuation Report is an in-depth analysis detailing your home's value as well as a comparison with similar homes in the area
Home Values in the Area
Average Home Value in this Area
Purchase History
| Date | Buyer | Sale Price | Title Company |
|---|---|---|---|
| Vasquez Blanca | -- | -- | |
| Vasquez Blanca | -- | -- | |
| Contreras Edgar R | $140,000 | -- | |
| Contreras Edgar R | $140,000 | -- | |
| Cardoso Miguel S | $94,900 | -- | |
| Cardoso Miguel S | $94,900 | -- |
Source: Public Records
Mortgage History
| Date | Status | Borrower | Loan Amount |
|---|---|---|---|
| Open | Vasquez Blanca | $145,000 | |
| Closed | Vasquez Blanca | $145,000 | |
| Previous Owner | Cardoso Miguel S | $200,000 | |
| Previous Owner | Cardoso Miguel S | $170,000 | |
| Previous Owner | Cardoso Miguel S | $141,500 |
Source: Public Records
Tax History Compared to Growth
Tax History
| Year | Tax Paid | Tax Assessment Tax Assessment Total Assessment is a certain percentage of the fair market value that is determined by local assessors to be the total taxable value of land and additions on the property. | Land | Improvement |
|---|---|---|---|---|
| 2025 | $7,640 | $630,900 | $137,500 | $493,400 |
| 2024 | $7,174 | $596,800 | $137,500 | $459,300 |
| 2023 | $6,519 | $502,200 | $102,600 | $399,600 |
| 2022 | $6,323 | $452,600 | $93,200 | $359,400 |
| 2021 | $5,862 | $404,300 | $77,100 | $327,200 |
| 2020 | $0 | $328,700 | $72,600 | $256,100 |
| 2019 | $5,358 | $344,800 | $70,400 | $274,400 |
| 2018 | $5,155 | $321,000 | $70,400 | $250,600 |
| 2017 | $4,479 | $278,200 | $70,400 | $207,800 |
| 2016 | $4,227 | $243,500 | $68,200 | $175,300 |
| 2015 | $3,610 | $198,900 | $68,200 | $130,700 |
| 2014 | $3,553 | $196,000 | $68,200 | $127,800 |
Source: Public Records
Map
Nearby Homes
- 15 Bouve Ave
- 266 Forest Ave
- 11 Ridge Hill Ave
- 276 Forest Ave
- 15 Ridge Hill Ave
- 23 Bouve Ave
- 280 Forest Ave
- 10 Bouve Ave
- 14 Ridge Hill Ave
- 286 Forest Ave
- 16 Bouve Ave
- 18 Ridge Hill Ave
- 19 Ridge Hill Ave
- 20 Bouve Ave
- 252 Forest Ave
- 269 Forest Ave
- 290 Forest Ave
- 273 Forest Ave
- 265 Forest Ave
- 31 Bouve Ave