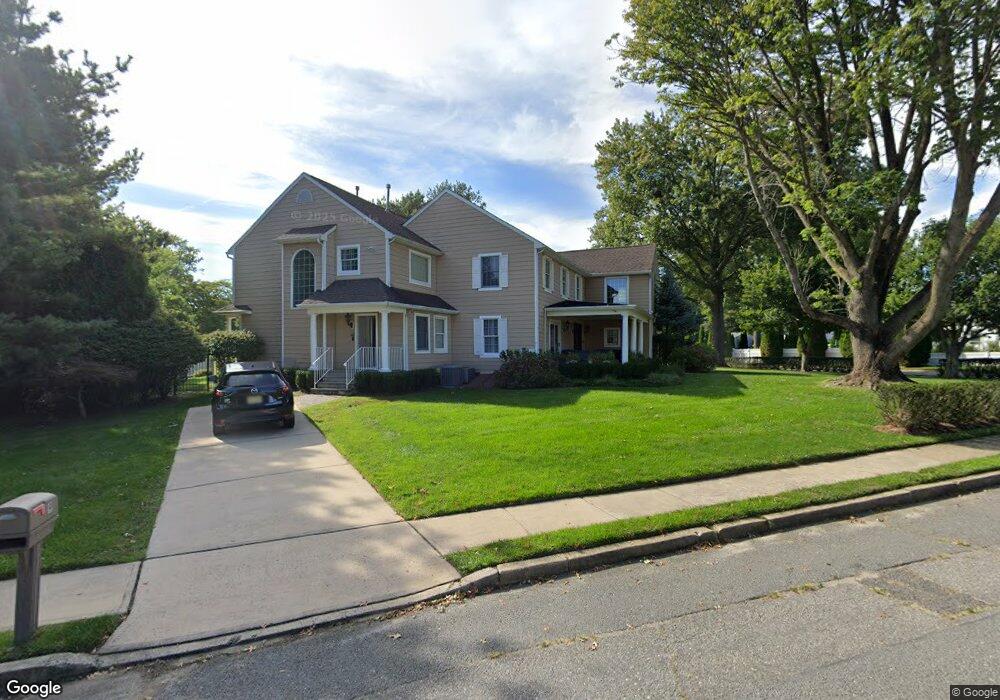
9 Bridle Dr West Long Branch, NJ 07764
Estimated Value: $2,639,826 - $3,231,000
6
Beds
7
Baths
5,610
Sq Ft
$518/Sq Ft
Est. Value
About This Home
This home is located at 9 Bridle Dr, West Long Branch, NJ 07764 and is currently estimated at $2,907,707, approximately $518 per square foot. 9 Bridle Dr is a home located in Monmouth County with nearby schools including Betty McElmon Elementary School, Frank Antonides School, and Shore Regional High School.
Ownership History
Date
Name
Owned For
Owner Type
Purchase Details
Closed on
Jul 1, 2024
Sold by
Sitt Morris and Sitt Esther
Bought by
Morris Sitt Irrevocable Trust
Current Estimated Value
Purchase Details
Closed on
May 25, 2003
Sold by
Fliger Robert
Bought by
Morris Sitt and Sitt Esther
Home Financials for this Owner
Home Financials are based on the most recent Mortgage that was taken out on this home.
Original Mortgage
$314,800
Interest Rate
5.28%
Create a Home Valuation Report for This Property
The Home Valuation Report is an in-depth analysis detailing your home's value as well as a comparison with similar homes in the area
Home Values in the Area
Average Home Value in this Area
Purchase History
| Date | Buyer | Sale Price | Title Company |
|---|---|---|---|
| Morris Sitt Irrevocable Trust | -- | None Listed On Document | |
| Morris Sitt Irrevocable Trust | -- | None Listed On Document | |
| Morris Sitt | $850,000 | -- |
Source: Public Records
Mortgage History
| Date | Status | Borrower | Loan Amount |
|---|---|---|---|
| Previous Owner | Morris Sitt | $314,800 |
Source: Public Records
Tax History Compared to Growth
Tax History
| Year | Tax Paid | Tax Assessment Tax Assessment Total Assessment is a certain percentage of the fair market value that is determined by local assessors to be the total taxable value of land and additions on the property. | Land | Improvement |
|---|---|---|---|---|
| 2025 | $27,512 | $2,219,500 | $1,064,000 | $1,155,500 |
| 2024 | $27,265 | $2,111,400 | $977,100 | $1,134,300 |
| 2023 | $27,265 | $1,951,700 | $801,500 | $1,150,200 |
| 2022 | $26,201 | $1,766,800 | $725,800 | $1,041,000 |
| 2021 | $26,201 | $1,380,800 | $503,000 | $877,800 |
| 2020 | $23,037 | $1,121,000 | $403,000 | $718,000 |
| 2019 | $22,318 | $1,091,900 | $378,000 | $713,900 |
| 2018 | $22,402 | $1,058,700 | $378,000 | $680,700 |
| 2017 | $22,614 | $1,020,500 | $360,600 | $659,900 |
| 2016 | $22,135 | $1,019,100 | $375,800 | $643,300 |
| 2015 | $21,804 | $1,002,500 | $375,800 | $626,700 |
| 2014 | $22,110 | $948,500 | $350,800 | $597,700 |
Source: Public Records
Map
Nearby Homes
- 494 Monmouth Rd
- 11 Bridle Dr
- 1 Old Farm Rd
- 10 Bridle Dr
- 500 Monmouth Rd
- 8 Bridle Dr
- 484 Monmouth Rd
- 13 Bridle Dr
- 3 Townsend Place
- 5 Bridle Dr
- 482 Monmouth Rd
- 502 Monmouth Rd
- 12 Bridle Dr
- 15 Bridle Dr
- 2 Cubero Ct
- 2 Bridle Dr
- 503 Monmouth Rd
- 4 Townsend Place
- 505 Monmouth Rd
- 505 Monmouth Rd Unit WINTER