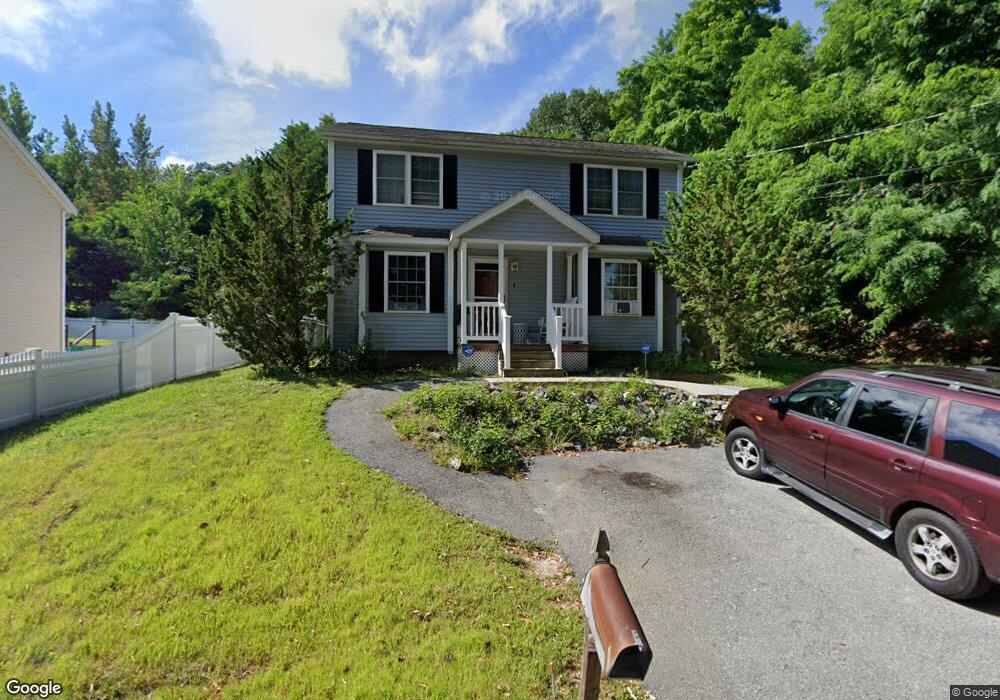
9 Bruce St Unit Lot 1 Fitchburg, MA 01420
Estimated Value: $266,000 - $421,000
3
Beds
2
Baths
1,200
Sq Ft
$302/Sq Ft
Est. Value
About This Home
This home is located at 9 Bruce St Unit Lot 1, Fitchburg, MA 01420 and is currently estimated at $361,952, approximately $301 per square foot. 9 Bruce St Unit Lot 1 is a home located in Worcester County with nearby schools including South Street Elementary School, Crocker Elementary School, and Reingold Elementary School.
Ownership History
Date
Name
Owned For
Owner Type
Purchase Details
Closed on
Apr 20, 2007
Sold by
Ketola and Ketola Warren
Bought by
Phillips Jermaine T and Phillips Shabana K
Current Estimated Value
Home Financials for this Owner
Home Financials are based on the most recent Mortgage that was taken out on this home.
Original Mortgage
$199,900
Interest Rate
6.19%
Mortgage Type
Purchase Money Mortgage
Create a Home Valuation Report for This Property
The Home Valuation Report is an in-depth analysis detailing your home's value as well as a comparison with similar homes in the area
Home Values in the Area
Average Home Value in this Area
Purchase History
| Date | Buyer | Sale Price | Title Company |
|---|---|---|---|
| Phillips Jermaine T | $199,900 | -- | |
| Ketola | $60,000 | -- | |
| Ketola | $60,000 | -- |
Source: Public Records
Mortgage History
| Date | Status | Borrower | Loan Amount |
|---|---|---|---|
| Open | Ketola | $185,576 | |
| Closed | Ketola | $199,900 | |
| Closed | Ketola | $0 |
Source: Public Records
Tax History Compared to Growth
Tax History
| Year | Tax Paid | Tax Assessment Tax Assessment Total Assessment is a certain percentage of the fair market value that is determined by local assessors to be the total taxable value of land and additions on the property. | Land | Improvement |
|---|---|---|---|---|
| 2025 | $45 | $329,800 | $87,500 | $242,300 |
| 2024 | $4,307 | $290,800 | $54,000 | $236,800 |
| 2023 | $4,162 | $259,800 | $41,400 | $218,400 |
| 2022 | $3,950 | $224,300 | $38,900 | $185,400 |
| 2021 | $3,857 | $202,700 | $32,600 | $170,100 |
| 2020 | $3,737 | $189,600 | $30,100 | $159,500 |
| 2019 | $3,594 | $175,400 | $40,200 | $135,200 |
| 2018 | $3,462 | $164,800 | $37,700 | $127,100 |
| 2017 | $3,060 | $142,400 | $26,400 | $116,000 |
| 2016 | $2,993 | $141,000 | $26,400 | $114,600 |
| 2015 | $2,734 | $132,200 | $27,600 | $104,600 |
| 2014 | $2,622 | $132,200 | $27,600 | $104,600 |
Source: Public Records
Map
Nearby Homes
- 230 Kimball St
- 36 Hazel St
- 38 Hazel St
- 332 Kimball St
- 140-142 Leighton St
- 9 Brigham St
- 132 Hazel St
- 62 Grove St
- 520 Main St
- 10 Prospect St
- 25-27 Winthrop St
- 13-15 Chestnut St
- 58 Oliver St
- 11 Beech Street Ln
- 39 Arlington St
- 196 Hazel St
- 58 Arlington St Unit 60
- 47 Arlington St
- 33 Huron St Unit 10
- 154 Pleasant St
- 9 Bruce St
- 3 Bruce St
- 3 Bruce St Unit Lot 2
- 147 Rollstone St
- 147 Rollstone St Unit Lot 3
- 157 Rollstone St
- 157 Rollstone St Unit Lot 4
- 157 Rollstone St Unit 1
- 127 Rollstone St
- 12 Bruce St
- 142 Rollstone St
- 165 Rollstone St
- 165 Rollstone St Unit Lot 5
- 152 Rollstone St
- 18 Foster St
- 15 Willard St
- 12 Foster St
- 11 Willard St
- 206 Kimball St
- Lot 0 Willard St