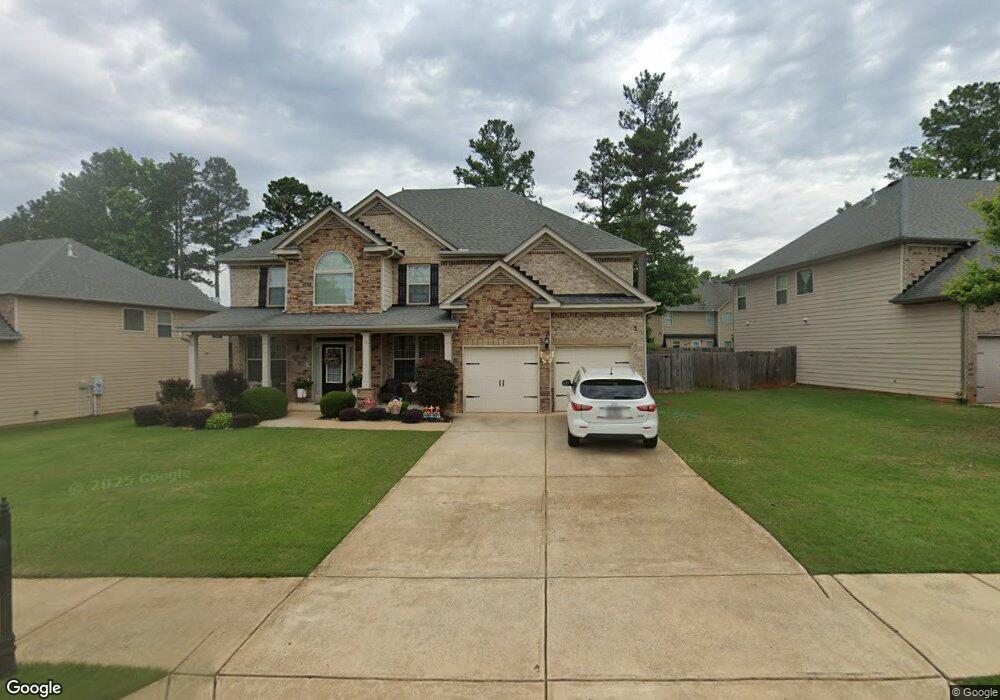
9 Bryce Creek Dr Newnan, GA 30265
Estimated Value: $496,375 - $529,000
--
Bed
--
Bath
3,616
Sq Ft
$142/Sq Ft
Est. Value
About This Home
This home is located at 9 Bryce Creek Dr, Newnan, GA 30265 and is currently estimated at $512,594, approximately $141 per square foot. 9 Bryce Creek Dr is a home with nearby schools including Newnan Crossing Elementary School, Arnall Middle School, and East Coweta High School.
Ownership History
Date
Name
Owned For
Owner Type
Purchase Details
Closed on
Sep 22, 2014
Sold by
Peachtree Comm At Highlands At
Bought by
Clark Veronica
Current Estimated Value
Home Financials for this Owner
Home Financials are based on the most recent Mortgage that was taken out on this home.
Original Mortgage
$212,464
Outstanding Balance
$162,715
Interest Rate
4.15%
Mortgage Type
New Conventional
Estimated Equity
$349,879
Purchase Details
Closed on
Mar 12, 2014
Sold by
Highlands Atlanta Llc
Bought by
Peachtree Communities At Highl
Purchase Details
Closed on
Jun 30, 2011
Sold by
Charterbank
Bought by
Highlands Atlanta Llc
Purchase Details
Closed on
May 4, 2010
Sold by
Wc Newnan Llc
Bought by
Charterbank
Purchase Details
Closed on
Sep 9, 2005
Sold by
Newnan Crossing Partnership
Bought by
Wc Newnan Llc
Purchase Details
Closed on
Jul 6, 2001
Sold by
Newnan Crossing Partnership
Bought by
Newnan Crossing Partnership
Create a Home Valuation Report for This Property
The Home Valuation Report is an in-depth analysis detailing your home's value as well as a comparison with similar homes in the area
Home Values in the Area
Average Home Value in this Area
Purchase History
| Date | Buyer | Sale Price | Title Company |
|---|---|---|---|
| Clark Veronica | $265,580 | -- | |
| Peachtree Communities At Highl | $168,000 | -- | |
| Highlands Atlanta Llc | $22,800 | -- | |
| Charterbank | $3,239,100 | -- | |
| Wc Newnan Llc | $2,200,000 | -- | |
| Newnan Crossing Partnership | $609,000 | -- |
Source: Public Records
Mortgage History
| Date | Status | Borrower | Loan Amount |
|---|---|---|---|
| Open | Clark Veronica | $212,464 |
Source: Public Records
Tax History Compared to Growth
Tax History
| Year | Tax Paid | Tax Assessment Tax Assessment Total Assessment is a certain percentage of the fair market value that is determined by local assessors to be the total taxable value of land and additions on the property. | Land | Improvement |
|---|---|---|---|---|
| 2024 | $4,343 | $193,479 | $36,000 | $157,479 |
| 2023 | $4,343 | $160,699 | $16,000 | $144,699 |
| 2022 | $3,674 | $154,487 | $16,000 | $138,487 |
| 2021 | $3,096 | $118,746 | $16,000 | $102,746 |
| 2020 | $3,164 | $118,746 | $16,000 | $102,746 |
| 2019 | $3,494 | $116,314 | $18,000 | $98,314 |
| 2018 | $3,515 | $116,314 | $18,000 | $98,314 |
| 2017 | $3,109 | $103,322 | $18,000 | $85,322 |
| 2016 | $3,111 | $103,322 | $18,000 | $85,322 |
| 2015 | $2,929 | $97,117 | $18,000 | $79,117 |
| 2014 | $350 | $10,500 | $10,500 | $0 |
Source: Public Records
Map
Nearby Homes
- 8 Bryce Creek Dr
- 81 Canyon View Dr
- 9 Ravine Dr
- 20 Bryce Creek Dr
- 35 Canyon View Dr
- 152 Stonebridge Crossing
- 100 Majestic Dr
- 80 Creekside Way
- 24 Stonebridge Pass
- 20 Stonebridge Pass
- 361 Granite Way
- 155 Granite Way
- 136 Granite Way
- 123 Stonebridge Crossing
- 103 Stonebridge Crossing
- 49 Granite Way
- 35 Stonebridge Blvd
- 11 Rockridge Dr
- 23 Carrington Way
- 10 Vintage Ave
- 7 Bryce Creek Dr
- 0 Bryce Creek Dr Unit 8741885
- 0 Bryce Creek Dr Unit 8749646
- 0 Bryce Creek Dr Unit 8753198
- 0 Bryce Creek Dr Unit 8768087
- 0 Bryce Creek Dr Unit 7430182
- 0 Bryce Creek Dr Unit 7448966
- 0 Bryce Creek Dr Unit 7579757
- 0 Bryce Creek Dr Unit 7635977
- 0 Bryce Creek Dr Unit 8247337
- 0 Bryce Creek Dr Unit 8313196
- 0 Bryce Creek Dr Unit 8314928
- 0 Bryce Creek Dr Unit 8545017
- 0 Bryce Creek Dr Unit 15
- 83 Canyon View Dr
- 10 Bryce Creek Dr
- 85 Canyon View Dr
- 13 Bryce Creek Dr
- 5 Bryce Creek Dr
- 12 Bryce Creek Dr