Estimated Value: $244,788 - $285,000
3
Beds
1
Bath
1,421
Sq Ft
$190/Sq Ft
Est. Value
About This Home
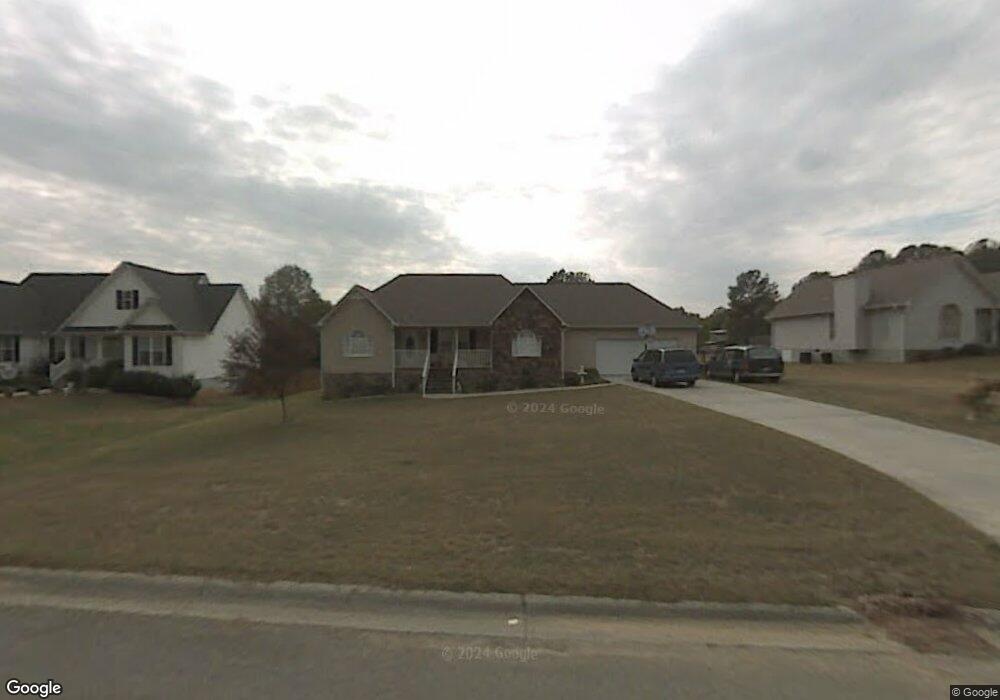
This home is located at 9 Buck Trail NE, Rome, GA 30165 and is currently estimated at $269,447, approximately $189 per square foot. 9 Buck Trail NE is a home located in Floyd County with nearby schools including Armuchee Middle School and Armuchee High School.
Ownership History
Date
Name
Owned For
Owner Type
Purchase Details
Closed on
Jan 2, 2018
Sold by
The Sec Of Veterans
Bought by
Evans David Glen
Current Estimated Value
Purchase Details
Closed on
Sep 5, 2017
Bought by
Secretary Of Veterans Affaris
Purchase Details
Closed on
Jul 12, 2006
Sold by
Not Provided
Bought by
Cooper George D and Cooper Melissa J
Home Financials for this Owner
Home Financials are based on the most recent Mortgage that was taken out on this home.
Original Mortgage
$159,900
Interest Rate
6.6%
Mortgage Type
VA
Purchase Details
Closed on
Mar 13, 2002
Sold by
Tison Tison J and Tison Pamela D
Bought by
Tison Pamela D
Purchase Details
Closed on
Mar 24, 1997
Sold by
Grissom Lee
Bought by
Tison Tison J and Tison Pamela D
Purchase Details
Closed on
Aug 13, 1996
Bought by
P and R
Purchase Details
Closed on
Feb 5, 1996
Bought by
P and R
Create a Home Valuation Report for This Property
The Home Valuation Report is an in-depth analysis detailing your home's value as well as a comparison with similar homes in the area
Home Values in the Area
Average Home Value in this Area
Purchase History
| Date | Buyer | Sale Price | Title Company |
|---|---|---|---|
| Evans David Glen | $125,000 | -- | |
| Secretary Of Veterans Affaris | $109,265 | -- | |
| Lakeview Loan Servicing Llc | $109,265 | -- | |
| Cooper George D | $159,900 | -- | |
| Tison Pamela D | -- | -- | |
| Tison Tison J | $97,900 | -- | |
| P | -- | -- | |
| P | -- | -- | |
| Grissom Lee | -- | -- |
Source: Public Records
Mortgage History
| Date | Status | Borrower | Loan Amount |
|---|---|---|---|
| Previous Owner | Cooper George D | $159,900 |
Source: Public Records
Tax History Compared to Growth
Tax History
| Year | Tax Paid | Tax Assessment Tax Assessment Total Assessment is a certain percentage of the fair market value that is determined by local assessors to be the total taxable value of land and additions on the property. | Land | Improvement |
|---|---|---|---|---|
| 2024 | $2,167 | $87,543 | $9,660 | $77,883 |
| 2023 | $2,174 | $85,618 | $9,660 | $75,958 |
| 2022 | $2,020 | $74,265 | $9,200 | $65,065 |
| 2021 | $1,956 | $69,066 | $9,200 | $59,866 |
| 2020 | $1,927 | $66,835 | $9,200 | $57,635 |
| 2019 | $1,459 | $61,470 | $9,200 | $52,270 |
| 2018 | $1,847 | $59,732 | $9,200 | $50,532 |
| 2017 | $1,762 | $56,766 | $9,200 | $47,566 |
| 2016 | $1,904 | $60,720 | $9,200 | $51,520 |
| 2015 | $1,836 | $59,793 | $9,200 | $50,593 |
| 2014 | $1,836 | $59,793 | $9,200 | $50,593 |
Source: Public Records
Map
Nearby Homes
- 0 Marlene Dr NE Unit 10656253
- 0 Marlene Dr NE Unit 7690328
- 201 Kellett Rd NE
- 282 Turner Rd NE
- 0 Turkey Mountain Rd NE Unit 10631876
- 0 Turkey Mountain Rd NE Unit 7669730
- 1291 Bells Ferry Rd NE
- 1 Green Acre Rd NE
- 1A Green Acre Rd NE
- 25 Wynnie Rd NE
- 26 Hatfield Rd NE
- 0 Hatfield Rd NE Unit 7533301
- 6 Don Dr NE
- 1035 Turkey Mountain Rd NE
- 1 Wynnie Rd NE
- 11 Stonegable Dr NW
- Tupelo Plan at Summer Club
- Elder Plan at Summer Club
- Hazel Plan at Summer Club
- Spruce Plan at Summer Club
- 11 Buck Trail NE
- 7 Buck Trail NE
- 13 Buck Trail NE
- 5 Buck Trail NE
- 8 Buck Trail NE
- 15 Buck Trail NE
- 3 Buck Trail NE
- 6 Buck Trail NE
- 12 Buck Trail NE
- 14 Buck Trail NE
- 17 Buck Trail NE
- 16 Buck Trail NE
- 4 Buck Trail NE
- 1 Buck Trail NE
- 2563 Old Dalton Rd NE
- 2575 Old Dalton Rd NE
- 46 W Troutman Rd NE
- 62 W Troutman Rd NE
- 80 W Troutman Rd NE
- 2661 Old Dalton Rd NE