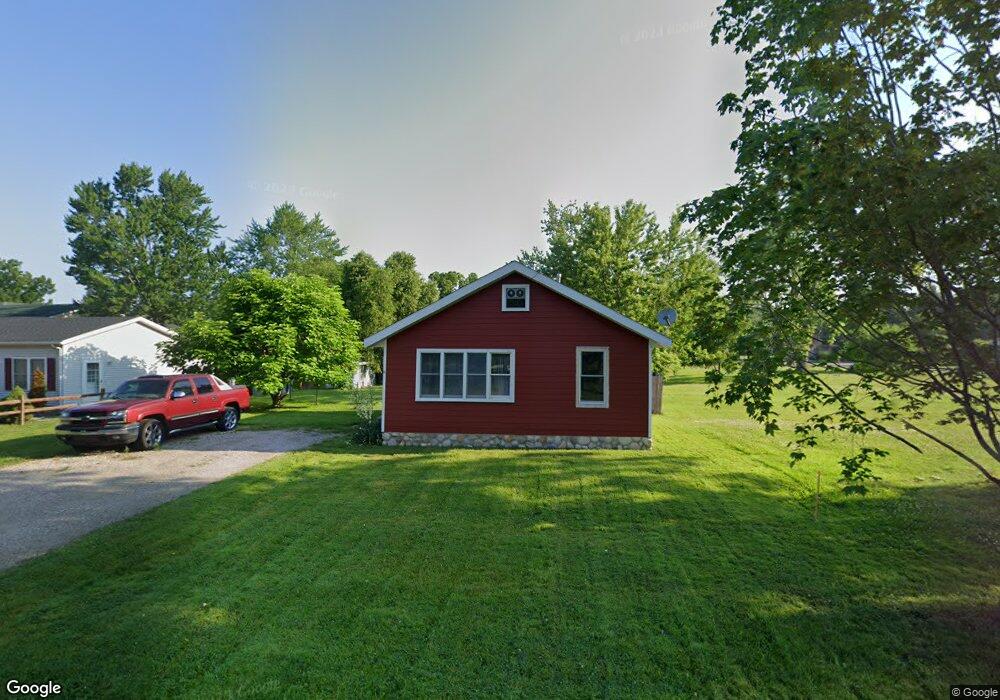
9 Buckeye St Three Oaks, MI 49128
Estimated Value: $184,907 - $250,000
2
Beds
1
Bath
625
Sq Ft
$328/Sq Ft
Est. Value
About This Home
This home is located at 9 Buckeye St, Three Oaks, MI 49128 and is currently estimated at $204,727, approximately $327 per square foot. 9 Buckeye St is a home located in Berrien County with nearby schools including River Valley Middle/High School and Lutie High School.
Ownership History
Date
Name
Owned For
Owner Type
Purchase Details
Closed on
Jul 2, 2018
Sold by
Zebell Michael J
Bought by
Hibner Jason B
Current Estimated Value
Home Financials for this Owner
Home Financials are based on the most recent Mortgage that was taken out on this home.
Original Mortgage
$55,555
Outstanding Balance
$48,253
Interest Rate
4.6%
Mortgage Type
New Conventional
Estimated Equity
$156,474
Purchase Details
Closed on
May 16, 2018
Sold by
Zebell Michael J
Bought by
Hibner Jason G
Home Financials for this Owner
Home Financials are based on the most recent Mortgage that was taken out on this home.
Original Mortgage
$55,555
Outstanding Balance
$48,253
Interest Rate
4.6%
Mortgage Type
New Conventional
Estimated Equity
$156,474
Purchase Details
Closed on
Jun 30, 1999
Create a Home Valuation Report for This Property
The Home Valuation Report is an in-depth analysis detailing your home's value as well as a comparison with similar homes in the area
Home Values in the Area
Average Home Value in this Area
Purchase History
| Date | Buyer | Sale Price | Title Company |
|---|---|---|---|
| Hibner Jason B | -- | None Listed On Document | |
| Hibner Jason G | -- | None Available | |
| -- | $27,500 | -- |
Source: Public Records
Mortgage History
| Date | Status | Borrower | Loan Amount |
|---|---|---|---|
| Open | Hibner Jason B | $55,555 | |
| Previous Owner | Hibner Jason G | $55,555 |
Source: Public Records
Tax History Compared to Growth
Tax History
| Year | Tax Paid | Tax Assessment Tax Assessment Total Assessment is a certain percentage of the fair market value that is determined by local assessors to be the total taxable value of land and additions on the property. | Land | Improvement |
|---|---|---|---|---|
| 2025 | $742 | $71,300 | $0 | $0 |
| 2024 | $916 | $60,800 | $0 | $0 |
| 2023 | $871 | $65,100 | $0 | $0 |
| 2022 | $838 | $55,400 | $0 | $0 |
| 2021 | $1,168 | $35,000 | $11,300 | $23,700 |
| 2020 | $1,099 | $28,700 | $0 | $0 |
| 2019 | $1,330 | $38,500 | $5,600 | $32,900 |
| 2018 | $879 | $38,500 | $0 | $0 |
| 2017 | $830 | $38,728 | $0 | $0 |
| 2016 | $874 | $38,053 | $0 | $0 |
| 2015 | $811 | $35,059 | $0 | $0 |
| 2014 | $229 | $32,217 | $0 | $0 |
Source: Public Records
Map
Nearby Homes