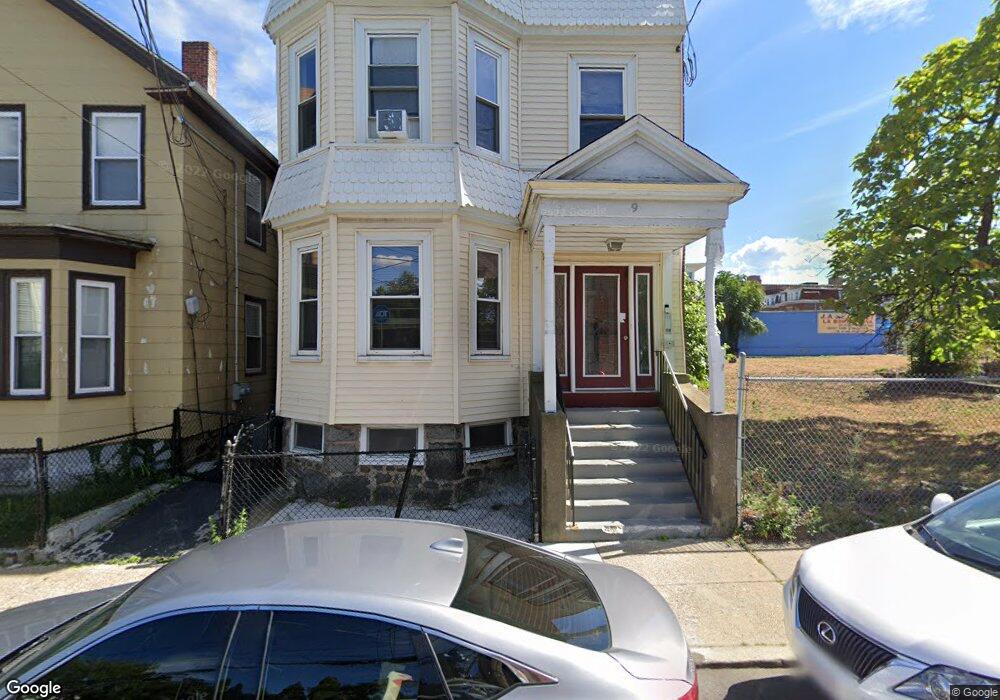
9 Burrell St Roxbury, MA 02119
Dudley-Brunswick King NeighborhoodEstimated Value: $615,933 - $809,000
6
Beds
3
Baths
3,504
Sq Ft
$201/Sq Ft
Est. Value
About This Home
This home is located at 9 Burrell St, Roxbury, MA 02119 and is currently estimated at $703,733, approximately $200 per square foot. 9 Burrell St is a home located in Suffolk County with nearby schools including Dudley Street Neighborhood Charter School.
Ownership History
Date
Name
Owned For
Owner Type
Purchase Details
Closed on
Oct 25, 2011
Sold by
Db Neighborhood Homes
Bought by
Ortiz Kathyria
Current Estimated Value
Home Financials for this Owner
Home Financials are based on the most recent Mortgage that was taken out on this home.
Original Mortgage
$258,282
Outstanding Balance
$175,494
Interest Rate
4.25%
Mortgage Type
FHA
Estimated Equity
$528,239
Purchase Details
Closed on
Dec 30, 2009
Sold by
Lorenzo Elias
Bought by
Db Neigborhood Homes L
Home Financials for this Owner
Home Financials are based on the most recent Mortgage that was taken out on this home.
Original Mortgage
$1,750,000
Interest Rate
4.85%
Mortgage Type
Purchase Money Mortgage
Purchase Details
Closed on
Jan 4, 2006
Sold by
Milton Jesse
Bought by
Elias Lorenzo Acevedo Elias and Elias Lorenzo
Home Financials for this Owner
Home Financials are based on the most recent Mortgage that was taken out on this home.
Original Mortgage
$280,000
Interest Rate
6.28%
Mortgage Type
Purchase Money Mortgage
Create a Home Valuation Report for This Property
The Home Valuation Report is an in-depth analysis detailing your home's value as well as a comparison with similar homes in the area
Home Values in the Area
Average Home Value in this Area
Purchase History
| Date | Buyer | Sale Price | Title Company |
|---|---|---|---|
| Ortiz Kathyria | $265,000 | -- | |
| Db Neigborhood Homes L | $149,000 | -- | |
| Elias Lorenzo Acevedo Elias | $350,000 | -- |
Source: Public Records
Mortgage History
| Date | Status | Borrower | Loan Amount |
|---|---|---|---|
| Open | Ortiz Kathyria | $258,282 | |
| Previous Owner | Db Neigborhood Homes L | $1,750,000 | |
| Previous Owner | Elias Lorenzo Acevedo Elias | $280,000 |
Source: Public Records
Tax History
| Year | Tax Paid | Tax Assessment Tax Assessment Total Assessment is a certain percentage of the fair market value that is determined by local assessors to be the total taxable value of land and additions on the property. | Land | Improvement |
|---|---|---|---|---|
| 2025 | $5,511 | $475,900 | $157,047 | $318,853 |
| 2024 | $4,940 | $453,200 | $122,364 | $330,836 |
| 2023 | $4,635 | $431,600 | $116,532 | $315,068 |
| 2022 | $4,472 | $411,000 | $110,970 | $300,030 |
| 2021 | $4,176 | $391,400 | $0 | $391,400 |
| 2020 | $3,937 | $372,800 | $0 | $372,800 |
| 2019 | $3,742 | $355,000 | $108,500 | $246,500 |
| 2018 | $3,543 | $338,100 | $108,500 | $229,600 |
| 2017 | $3,410 | $322,000 | $108,500 | $213,500 |
| 2016 | $3,374 | $306,700 | $108,500 | $198,200 |
| 2015 | $3,537 | $292,100 | $83,100 | $209,000 |
| 2014 | $3,500 | $278,200 | $83,100 | $195,100 |
Source: Public Records
Map
Nearby Homes
- 1-3 Howard Place Unit B
- 66 Burrell St
- 69 Burrell St
- 9 Batchelder St Unit 1
- 47 W Cottage St Unit 1
- 24 Clarence St Unit 24R
- 14 Robey St Unit 14
- 23 Woodward Park St
- 80 Blue Hill Ave Unit 5
- 84 Blue Hill Ave Unit 86
- 39 Julian St
- 45 Woodville St
- 38 Woodford St
- 27 Julian St
- 25 Hillsboro St Unit 1
- 4 Rand Place
- 36 Brookford St
- Lot 84 Blue Hill Ave
- 45 Brookford St
- 133 Blue Hill Ave
- 9 Burrell St Unit 3
- 9 Burrell St Unit 2
- 9 Burrell St Unit 1
- 11 Burrell St
- 11 Burrell St Unit A
- 11 Burrell St Unit PH
- 11 Burrell St Unit 1
- 11 Burrell St Unit 2
- 13 Burrell St
- 15-17 Burrell St Unit 1
- 15 Burrell St Unit 17
- 10 Albion St
- 8 Albion St
- 12 Albion St
- 12 Albion St Unit 1
- 18 Burrell St
- 14 Burrell St
- 19 Burrell St
- 19 Burrell St Unit 2
- 526-530 Dudley St
Your Personal Tour Guide
Ask me questions while you tour the home.