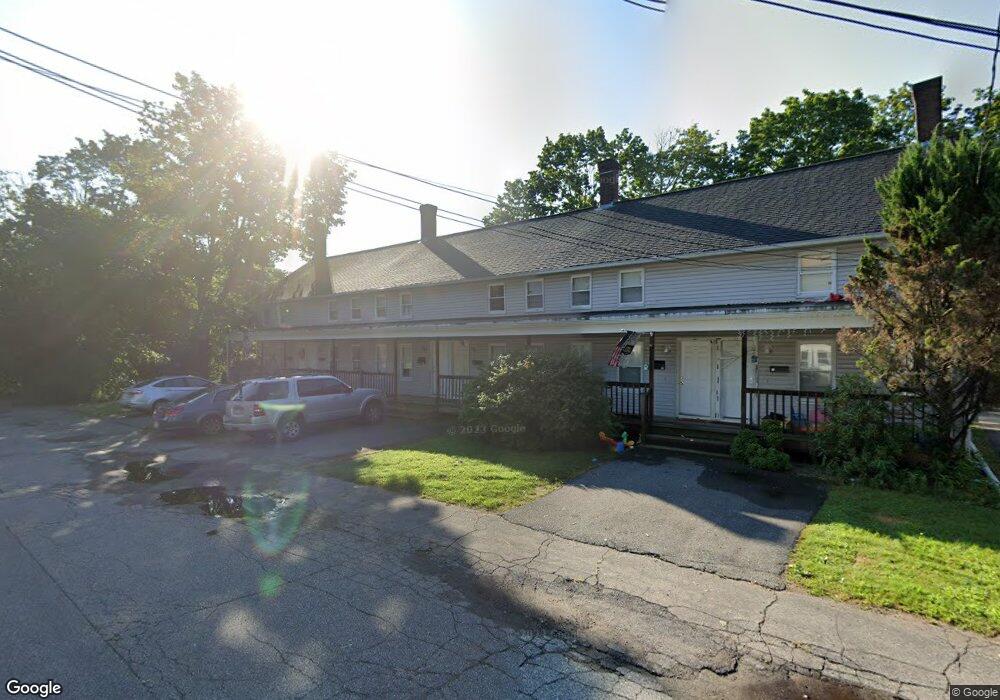
9 C St Whitinsville, MA 01588
Estimated Value: $207,000 - $225,000
2
Beds
2
Baths
726
Sq Ft
$302/Sq Ft
Est. Value
About This Home
This home is located at 9 C St, Whitinsville, MA 01588 and is currently estimated at $219,211, approximately $301 per square foot. 9 C St is a home located in Worcester County with nearby schools including Northbridge Elementary School, Northbridge Middle School, and Northbridge High School.
Ownership History
Date
Name
Owned For
Owner Type
Purchase Details
Closed on
Aug 1, 2014
Sold by
Romanoff David M and Lowe Karen
Bought by
Piper Properties Llc
Current Estimated Value
Home Financials for this Owner
Home Financials are based on the most recent Mortgage that was taken out on this home.
Original Mortgage
$98,000
Outstanding Balance
$57,245
Interest Rate
6%
Mortgage Type
New Conventional
Estimated Equity
$161,966
Purchase Details
Closed on
Dec 5, 2007
Sold by
Time Mortgage Co Llc
Bought by
Romanoff David M
Purchase Details
Closed on
Feb 26, 2007
Sold by
Birch Hollow Llc and Kunz
Bought by
Time Mortgage Co Llc
Purchase Details
Closed on
Apr 11, 2006
Sold by
Kunz Kai
Bought by
Kunz Kai
Create a Home Valuation Report for This Property
The Home Valuation Report is an in-depth analysis detailing your home's value as well as a comparison with similar homes in the area
Home Values in the Area
Average Home Value in this Area
Purchase History
| Date | Buyer | Sale Price | Title Company |
|---|---|---|---|
| Piper Properties Llc | $68,500 | -- | |
| Piper Properties Llc | $68,500 | -- | |
| Romanoff David M | -- | -- | |
| Romanoff David M | -- | -- | |
| Time Mortgage Co Llc | $157,000 | -- | |
| Time Mortgage Co Llc | $157,000 | -- | |
| Kunz Kai | -- | -- |
Source: Public Records
Mortgage History
| Date | Status | Borrower | Loan Amount |
|---|---|---|---|
| Open | Piper Properties Llc | $98,000 | |
| Closed | Time Mortgage Co Llc | $98,000 |
Source: Public Records
Tax History Compared to Growth
Tax History
| Year | Tax Paid | Tax Assessment Tax Assessment Total Assessment is a certain percentage of the fair market value that is determined by local assessors to be the total taxable value of land and additions on the property. | Land | Improvement |
|---|---|---|---|---|
| 2025 | $1,562 | $132,500 | $0 | $132,500 |
| 2024 | $1,359 | $112,400 | $0 | $112,400 |
| 2023 | $1,094 | $84,400 | $0 | $84,400 |
| 2022 | $1,042 | $75,700 | $0 | $75,700 |
| 2021 | $961 | $66,300 | $0 | $66,300 |
| 2020 | $882 | $63,700 | $0 | $63,700 |
| 2019 | $792 | $61,100 | $0 | $61,100 |
| 2018 | $827 | $63,900 | $0 | $63,900 |
| 2017 | $771 | $57,000 | $0 | $57,000 |
| 2016 | $670 | $48,700 | $0 | $48,700 |
| 2015 | $652 | $48,700 | $0 | $48,700 |
| 2014 | $627 | $47,300 | $0 | $47,300 |
Source: Public Records
Map
Nearby Homes
- 14 C St Unit 24
- 14 C St Unit 14
- 2 D St
- 11 A St Unit 11
- 17 Overlook St
- 24 Crescent St Unit 6
- 111 Windsor Ridge Dr
- 201 Prescott Rd
- 56 Prescott Rd
- 9 Banning Dr
- 46 Rebecca Rd
- Lots 1-9 Spring St
- 3 Bayliss Way
- 1 Elm St
- 192 Rebecca Rd
- 22 Bayliss Way
- 26 Bayliss Way
- 86 Kingsnorth St
- 128 Linwood Ave
- 18 East St Unit 24