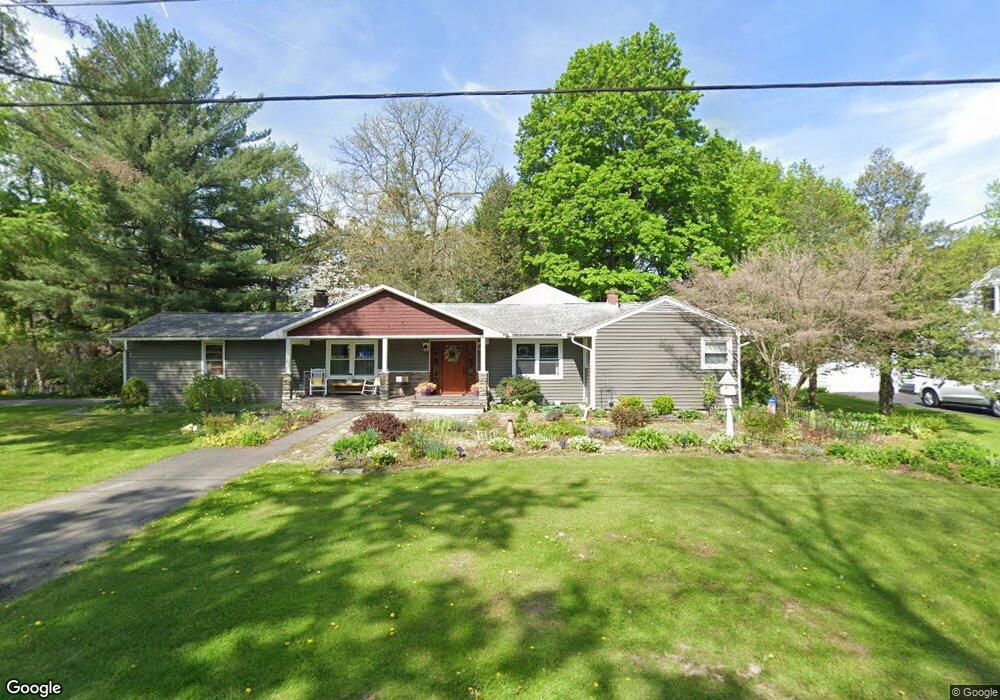
9 Calgary Ln Binghamton, NY 13901
Estimated Value: $267,473 - $315,000
3
Beds
2
Baths
2,076
Sq Ft
$141/Sq Ft
Est. Value
About This Home
This home is located at 9 Calgary Ln, Binghamton, NY 13901 and is currently estimated at $291,868, approximately $140 per square foot. 9 Calgary Ln is a home located in Broome County with nearby schools including Port Dickinson Elementary School, Chenango Bridge Elementary School, and Chenango Valley Middle School.
Ownership History
Date
Name
Owned For
Owner Type
Purchase Details
Closed on
May 26, 2017
Sold by
Grover Virginia
Bought by
Vesci Paul V and Vesci Carrie
Current Estimated Value
Home Financials for this Owner
Home Financials are based on the most recent Mortgage that was taken out on this home.
Original Mortgage
$150,000
Outstanding Balance
$124,769
Interest Rate
4.02%
Mortgage Type
Credit Line Revolving
Estimated Equity
$167,099
Purchase Details
Closed on
Apr 12, 2017
Sold by
Vesci Carrie
Bought by
Vesci Paul V and Vesci Carrie
Home Financials for this Owner
Home Financials are based on the most recent Mortgage that was taken out on this home.
Original Mortgage
$150,000
Outstanding Balance
$124,769
Interest Rate
4.02%
Mortgage Type
Credit Line Revolving
Estimated Equity
$167,099
Purchase Details
Closed on
Feb 3, 2017
Sold by
Grover Virginia S
Bought by
Vesci Carrie
Purchase Details
Closed on
Feb 3, 2016
Sold by
Grover Virginia S
Bought by
Vesci Carrie
Purchase Details
Closed on
Sep 16, 2000
Create a Home Valuation Report for This Property
The Home Valuation Report is an in-depth analysis detailing your home's value as well as a comparison with similar homes in the area
Home Values in the Area
Average Home Value in this Area
Purchase History
| Date | Buyer | Sale Price | Title Company |
|---|---|---|---|
| Vesci Paul V | -- | None Available | |
| Vesci Paul V | -- | None Available | |
| Vesci Carrie | -- | None Available | |
| Vesci Carrie | -- | None Available | |
| -- | -- | -- |
Source: Public Records
Mortgage History
| Date | Status | Borrower | Loan Amount |
|---|---|---|---|
| Open | Vesci Paul V | $150,000 |
Source: Public Records
Tax History Compared to Growth
Tax History
| Year | Tax Paid | Tax Assessment Tax Assessment Total Assessment is a certain percentage of the fair market value that is determined by local assessors to be the total taxable value of land and additions on the property. | Land | Improvement |
|---|---|---|---|---|
| 2024 | $7,937 | $131,900 | $17,300 | $114,600 |
| 2023 | $8,470 | $131,900 | $17,300 | $114,600 |
| 2022 | $8,211 | $131,900 | $17,300 | $114,600 |
| 2021 | $7,986 | $131,900 | $17,300 | $114,600 |
| 2020 | $7,891 | $131,900 | $17,300 | $114,600 |
| 2019 | -- | $131,900 | $17,300 | $114,600 |
| 2018 | $7,331 | $129,900 | $17,300 | $112,600 |
| 2017 | $4,517 | $112,100 | $17,300 | $94,800 |
| 2016 | $4,526 | $112,100 | $17,300 | $94,800 |
| 2015 | -- | $112,100 | $17,300 | $94,800 |
| 2014 | -- | $112,100 | $17,300 | $94,800 |
Source: Public Records
Map
Nearby Homes