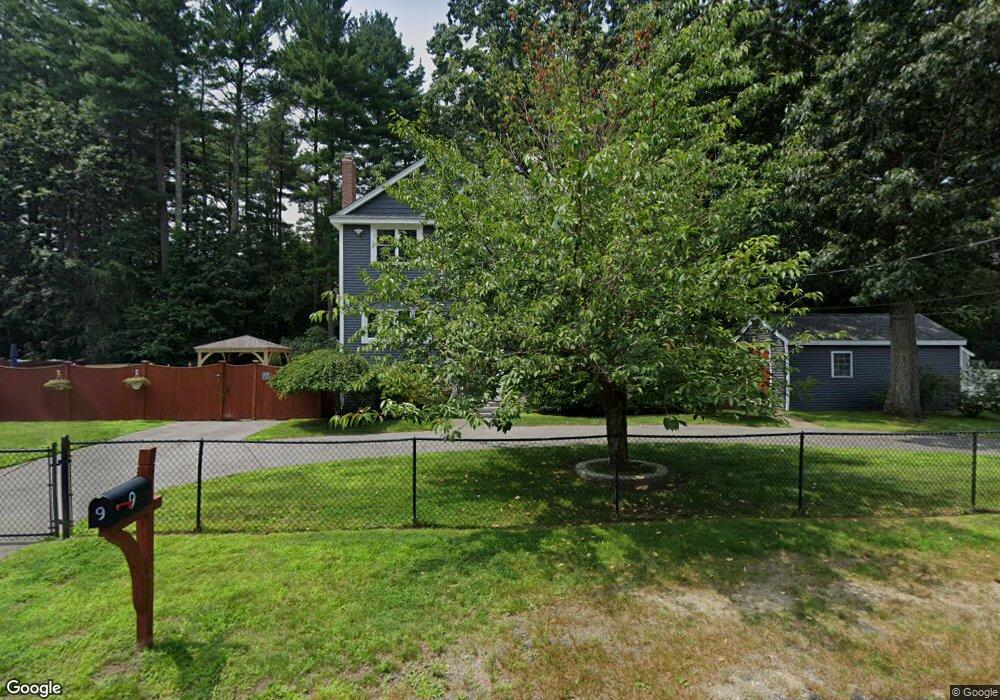
9 Carmel St Wilmington, MA 01887
Estimated Value: $855,000 - $1,007,000
4
Beds
4
Baths
2,088
Sq Ft
$443/Sq Ft
Est. Value
About This Home
This home is located at 9 Carmel St, Wilmington, MA 01887 and is currently estimated at $925,946, approximately $443 per square foot. 9 Carmel St is a home located in Middlesex County with nearby schools including Wilmington Middle School, Wilmington High School, and Abundant Life Christian School and Childcare.
Ownership History
Date
Name
Owned For
Owner Type
Purchase Details
Closed on
Mar 26, 2022
Sold by
Penney Anne M and Penney Mark D
Bought by
9 Carmel Street Rt
Current Estimated Value
Purchase Details
Closed on
Sep 26, 1997
Sold by
Wainwright Charles M and Wainwright Denise L
Bought by
Penney Mark D
Purchase Details
Closed on
Dec 18, 1987
Sold by
Mignault Have J
Bought by
Wainwright Charles H
Create a Home Valuation Report for This Property
The Home Valuation Report is an in-depth analysis detailing your home's value as well as a comparison with similar homes in the area
Home Values in the Area
Average Home Value in this Area
Purchase History
| Date | Buyer | Sale Price | Title Company |
|---|---|---|---|
| 9 Carmel Street Rt | -- | None Available | |
| Penney Mark D | $157,000 | -- | |
| Wainwright Charles H | $178,000 | -- |
Source: Public Records
Mortgage History
| Date | Status | Borrower | Loan Amount |
|---|---|---|---|
| Previous Owner | Wainwright Charles H | $262,000 | |
| Previous Owner | Wainwright Charles H | $50,000 | |
| Previous Owner | Wainwright Charles H | $224,000 |
Source: Public Records
Tax History Compared to Growth
Tax History
| Year | Tax Paid | Tax Assessment Tax Assessment Total Assessment is a certain percentage of the fair market value that is determined by local assessors to be the total taxable value of land and additions on the property. | Land | Improvement |
|---|---|---|---|---|
| 2025 | $10,330 | $902,200 | $302,800 | $599,400 |
| 2024 | $9,974 | $872,600 | $302,800 | $569,800 |
| 2023 | $9,325 | $781,000 | $275,300 | $505,700 |
| 2022 | $8,837 | $678,200 | $229,300 | $448,900 |
| 2021 | $8,859 | $640,100 | $208,400 | $431,700 |
| 2020 | $8,585 | $632,200 | $208,400 | $423,800 |
| 2019 | $7,970 | $579,600 | $198,500 | $381,100 |
| 2018 | $5,505 | $393,100 | $189,100 | $204,000 |
| 2017 | $5,505 | $381,000 | $184,600 | $196,400 |
| 2016 | $5,227 | $357,300 | $175,900 | $181,400 |
| 2015 | $4,984 | $346,800 | $175,900 | $170,900 |
| 2014 | $4,691 | $329,400 | $167,500 | $161,900 |
Source: Public Records
Map
Nearby Homes