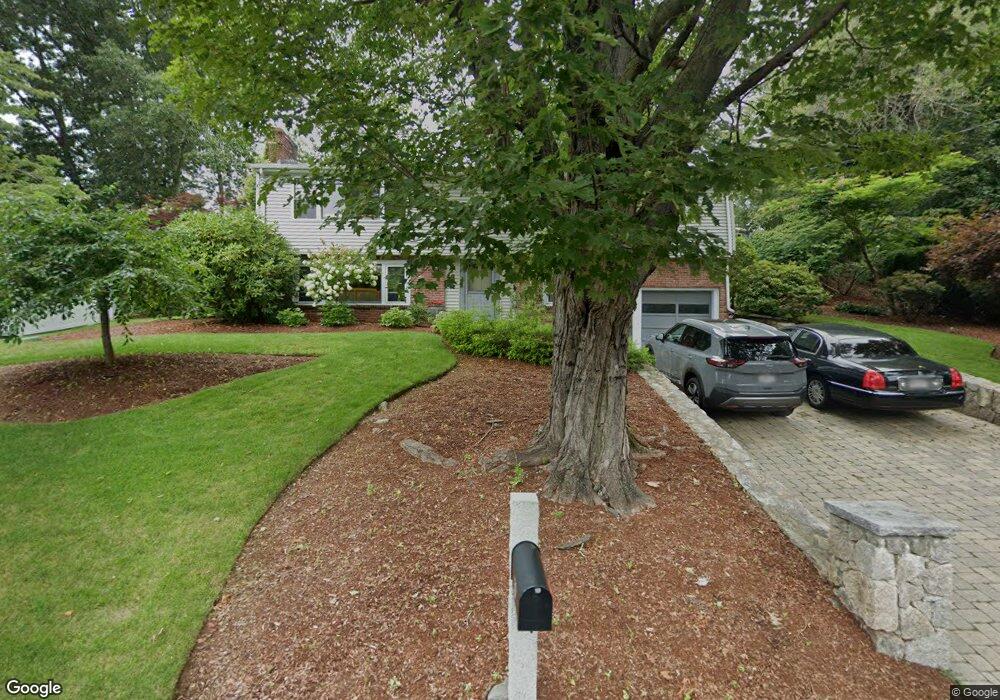
9 Carriage Ln Winchester, MA 01890
West Side NeighborhoodEstimated Value: $1,047,502 - $1,262,000
3
Beds
2
Baths
1,678
Sq Ft
$699/Sq Ft
Est. Value
About This Home
This home is located at 9 Carriage Ln, Winchester, MA 01890 and is currently estimated at $1,172,126, approximately $698 per square foot. 9 Carriage Ln is a home located in Middlesex County with nearby schools including Vinson-Owen Elementary School, McCall Middle School, and Winchester High School.
Ownership History
Date
Name
Owned For
Owner Type
Purchase Details
Closed on
Sep 23, 1993
Sold by
Wettstein Jonathan C
Bought by
Khalil Farid N and Kahalil Sophia
Current Estimated Value
Home Financials for this Owner
Home Financials are based on the most recent Mortgage that was taken out on this home.
Original Mortgage
$211,500
Interest Rate
7.1%
Mortgage Type
Purchase Money Mortgage
Create a Home Valuation Report for This Property
The Home Valuation Report is an in-depth analysis detailing your home's value as well as a comparison with similar homes in the area
Home Values in the Area
Average Home Value in this Area
Purchase History
| Date | Buyer | Sale Price | Title Company |
|---|---|---|---|
| Khalil Farid N | $235,000 | -- |
Source: Public Records
Mortgage History
| Date | Status | Borrower | Loan Amount |
|---|---|---|---|
| Open | Khalil Farid N | $272,700 | |
| Closed | Khalil Farid N | $211,500 |
Source: Public Records
Tax History Compared to Growth
Tax History
| Year | Tax Paid | Tax Assessment Tax Assessment Total Assessment is a certain percentage of the fair market value that is determined by local assessors to be the total taxable value of land and additions on the property. | Land | Improvement |
|---|---|---|---|---|
| 2025 | $113 | $1,019,500 | $730,100 | $289,400 |
| 2024 | $11,137 | $983,000 | $693,600 | $289,400 |
| 2023 | $10,029 | $849,900 | $602,300 | $247,600 |
| 2022 | $9,880 | $789,800 | $547,600 | $242,200 |
| 2021 | $9,197 | $716,800 | $474,600 | $242,200 |
| 2020 | $8,767 | $707,600 | $465,400 | $242,200 |
| 2019 | $8,017 | $662,000 | $419,800 | $242,200 |
| 2018 | $7,781 | $638,300 | $399,700 | $238,600 |
| 2017 | $7,619 | $620,400 | $399,700 | $220,700 |
| 2016 | $7,161 | $613,100 | $392,400 | $220,700 |
| 2015 | $6,915 | $569,600 | $365,000 | $204,600 |
| 2014 | $6,787 | $536,100 | $355,900 | $180,200 |
Source: Public Records
Map
Nearby Homes
- 7 Thornberry Rd
- 41 Squire Rd
- 26 Berkshire Dr
- 19 Gershon Way Unit 1
- 19 Gershon Way
- 14 Nassau Dr
- 20 Amberwood Dr
- 7 Grace Rd
- 16 Winning Farm Rd Unit 16
- 21 Derby Dr Unit 21
- 19 Cox Rd
- 257 High St
- 5 Azalea Rd
- 276 High St
- 500 Lexington St Unit 6
- 22 Tyler Rd
- 189 High St
- 8 Blueberry Ln
- 15 Peachtree Rd
- 30 Whipple Rd