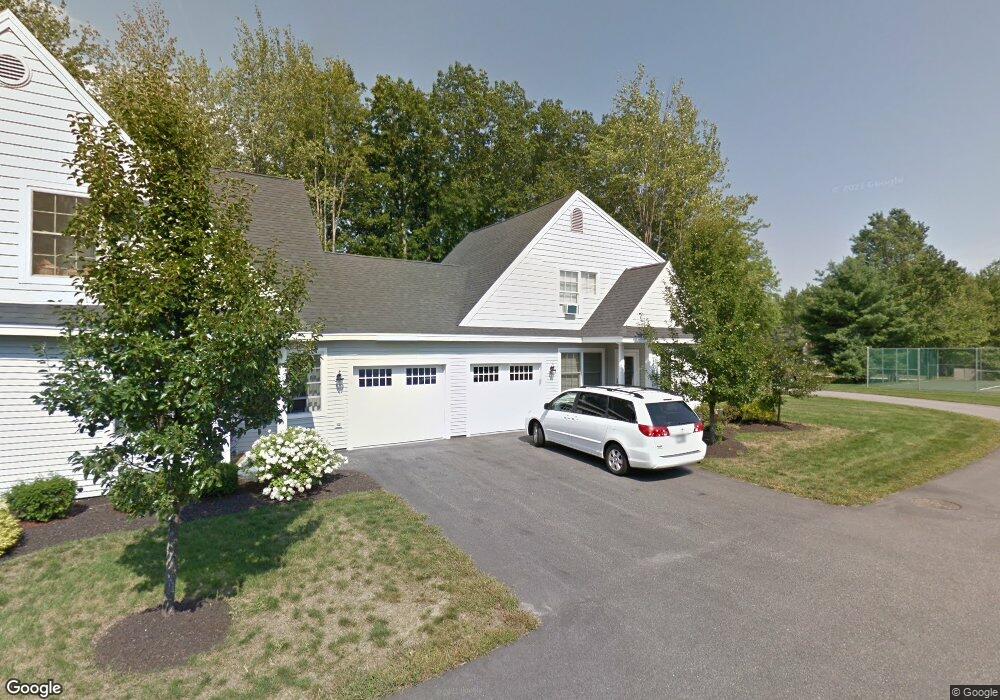
9 Carriage Way Unit 4 Saco, ME 04072
Central Saco NeighborhoodEstimated Value: $465,615 - $505,000
3
Beds
2
Baths
1,608
Sq Ft
$304/Sq Ft
Est. Value
About This Home
This home is located at 9 Carriage Way Unit 4, Saco, ME 04072 and is currently estimated at $489,404, approximately $304 per square foot. 9 Carriage Way Unit 4 is a home located in York County with nearby schools including C K Burns School, Saco Middle School, and Saint James School.
Ownership History
Date
Name
Owned For
Owner Type
Purchase Details
Closed on
Mar 5, 2025
Sold by
Meader Heidi H
Bought by
Meader Erica M and Meader Jessica M
Current Estimated Value
Purchase Details
Closed on
Jun 10, 2014
Sold by
Guy R & S C Paquette Lt and Paquette
Bought by
Meader Heidi
Purchase Details
Closed on
Mar 31, 2010
Sold by
Paquette Guy R and Paquette Suzanne C
Bought by
Suzanne & Guy Paquette Lt
Purchase Details
Closed on
May 13, 2008
Sold by
Bolster Clifford F and Bolster Susan A
Bought by
Paquette Guy R and Paquette Suzanne C
Home Financials for this Owner
Home Financials are based on the most recent Mortgage that was taken out on this home.
Original Mortgage
$182,000
Interest Rate
5.93%
Mortgage Type
Purchase Money Mortgage
Purchase Details
Closed on
Nov 23, 2005
Sold by
Rockwood Props Llc
Bought by
Bolster Susan A and Bolster Clifford F
Create a Home Valuation Report for This Property
The Home Valuation Report is an in-depth analysis detailing your home's value as well as a comparison with similar homes in the area
Home Values in the Area
Average Home Value in this Area
Purchase History
| Date | Buyer | Sale Price | Title Company |
|---|---|---|---|
| Meader Erica M | -- | None Available | |
| Meader Erica M | -- | None Available | |
| Meader Erica M | -- | None Available | |
| Meader Heidi | -- | -- | |
| Meader Heidi | -- | -- | |
| Suzanne & Guy Paquette Lt | -- | -- | |
| Suzanne & Guy Paquette Lt | -- | -- | |
| Paquette Guy R | -- | -- | |
| Paquette Guy R | -- | -- | |
| Bolster Susan A | -- | -- | |
| Bolster Susan A | -- | -- |
Source: Public Records
Mortgage History
| Date | Status | Borrower | Loan Amount |
|---|---|---|---|
| Previous Owner | Bolster Susan A | $182,000 |
Source: Public Records
Tax History Compared to Growth
Tax History
| Year | Tax Paid | Tax Assessment Tax Assessment Total Assessment is a certain percentage of the fair market value that is determined by local assessors to be the total taxable value of land and additions on the property. | Land | Improvement |
|---|---|---|---|---|
| 2024 | $4,975 | $354,100 | $108,900 | $245,200 |
| 2023 | $5,223 | $354,100 | $108,900 | $245,200 |
| 2022 | $4,654 | $253,900 | $83,000 | $170,900 |
| 2021 | $4,456 | $236,000 | $76,300 | $159,700 |
| 2020 | $4,251 | $216,100 | $73,100 | $143,000 |
| 2019 | $4,188 | $216,100 | $73,100 | $143,000 |
| 2018 | $4,058 | $209,400 | $66,400 | $143,000 |
| 2017 | $4,254 | $219,500 | $66,400 | $153,100 |
| 2016 | $3,964 | $204,100 | $55,500 | $148,600 |
| 2015 | $3,923 | $204,100 | $55,500 | $148,600 |
| 2014 | $3,800 | $204,100 | $55,500 | $148,600 |
| 2013 | $3,792 | $204,100 | $55,500 | $148,600 |
Source: Public Records
Map
Nearby Homes
- 5 Academy Place Unit 57
- 11 Louise St
- 15 Lucille St
- 36 Lafayette St
- 15 Lafayette St
- 22 Ocean Park Rd Unit 133
- 22 Ocean Park Rd Unit 136
- 162 Beach St Unit 10
- 4 Westward Ln
- 372 Main St Unit 201
- 61 Ocean Park Rd Unit 11
- 50 Ocean Park Rd Unit 12
- 22 James St
- 00 Sawyer St
- 16 Heritage Way Unit 17
- 18 Heritage Way Unit 14
- 9 Cross St
- 24 Roebuck Ave
- 642 Main St
- 8 Heritage Way Unit 15
- 9 Carriage Way
- 9 Carriage Way Unit 12
- 11 Carriage Way
- 15 Carriage Way
- 15 Carriage Way Unit 9
- 13 Carriage Way
- 8 Carriage Way
- 4 Carriage Way
- 4 Carriage Way Unit S2
- 2 Carriage Way
- 5 Academy Place Unit 64
- 5 Academy Place Unit 63
- 5 Academy Place Unit 62
- 5 Academy Place Unit 61
- 5 Academy Place Unit 60
- 5 Academy Place Unit 58
- 3 Academy Place Unit 72
- 3 Academy Place Unit 71
- 3 Academy Place Unit 70
- 3 Academy Place Unit 69