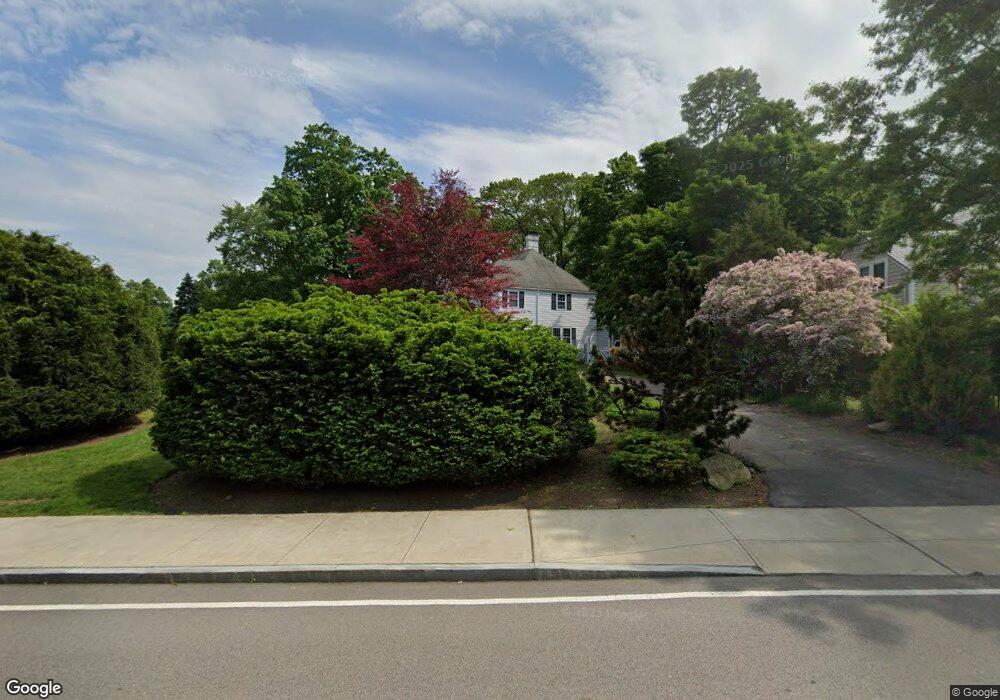
9 Cedar St Dedham, MA 02026
Oakdale NeighborhoodEstimated Value: $1,349,000 - $1,559,000
5
Beds
3
Baths
3,138
Sq Ft
$459/Sq Ft
Est. Value
About This Home
This home is located at 9 Cedar St, Dedham, MA 02026 and is currently estimated at $1,440,880, approximately $459 per square foot. 9 Cedar St is a home located in Norfolk County with nearby schools including Oakdale Elementary School, Dedham Middle School, and Dedham High School.
Ownership History
Date
Name
Owned For
Owner Type
Purchase Details
Closed on
Jan 30, 2024
Sold by
Kalell John M and Kalell Kathleen F
Bought by
Kalell Rt and Kalell
Current Estimated Value
Create a Home Valuation Report for This Property
The Home Valuation Report is an in-depth analysis detailing your home's value as well as a comparison with similar homes in the area
Home Values in the Area
Average Home Value in this Area
Purchase History
| Date | Buyer | Sale Price | Title Company |
|---|---|---|---|
| Kalell Rt | -- | None Available | |
| Kalell Rt | -- | None Available |
Source: Public Records
Tax History
| Year | Tax Paid | Tax Assessment Tax Assessment Total Assessment is a certain percentage of the fair market value that is determined by local assessors to be the total taxable value of land and additions on the property. | Land | Improvement |
|---|---|---|---|---|
| 2025 | $15,111 | $1,197,400 | $401,000 | $796,400 |
| 2024 | $14,848 | $1,187,800 | $368,900 | $818,900 |
| 2023 | $13,490 | $1,050,600 | $342,700 | $707,900 |
| 2022 | $12,454 | $932,900 | $313,400 | $619,500 |
| 2021 | $11,830 | $865,400 | $313,400 | $552,000 |
| 2020 | $11,500 | $838,200 | $300,600 | $537,600 |
| 2019 | $10,969 | $775,200 | $272,800 | $502,400 |
| 2018 | $10,988 | $755,200 | $252,800 | $502,400 |
| 2017 | $10,664 | $722,500 | $248,100 | $474,400 |
| 2016 | $10,910 | $704,300 | $220,000 | $484,300 |
| 2015 | $10,462 | $659,200 | $213,800 | $445,400 |
| 2014 | $10,566 | $657,100 | $213,800 | $443,300 |
Source: Public Records
Map
Nearby Homes
- 98 Cedar St Unit 2
- 90 High St Unit 309
- 600 East St
- 108 High St
- 30 High St ( Cass St Entrance) Unit 209
- 56 Mount Vernon St
- 7 S Stone Mill Dr Unit 403
- 45 Circuit Rd
- 12 Blossom St
- 28 Linden Place
- 58 Jersey St
- 5 Lewis Farm Rd
- 19 Lewis Ln
- 442 High St
- 38 Fleming St
- 4 Mount Hope St
- 50 Sprague St
- 59 Hamilton Ave
- 1905 River St Unit 1905
- 42 Churchill Place
Your Personal Tour Guide
Ask me questions while you tour the home.