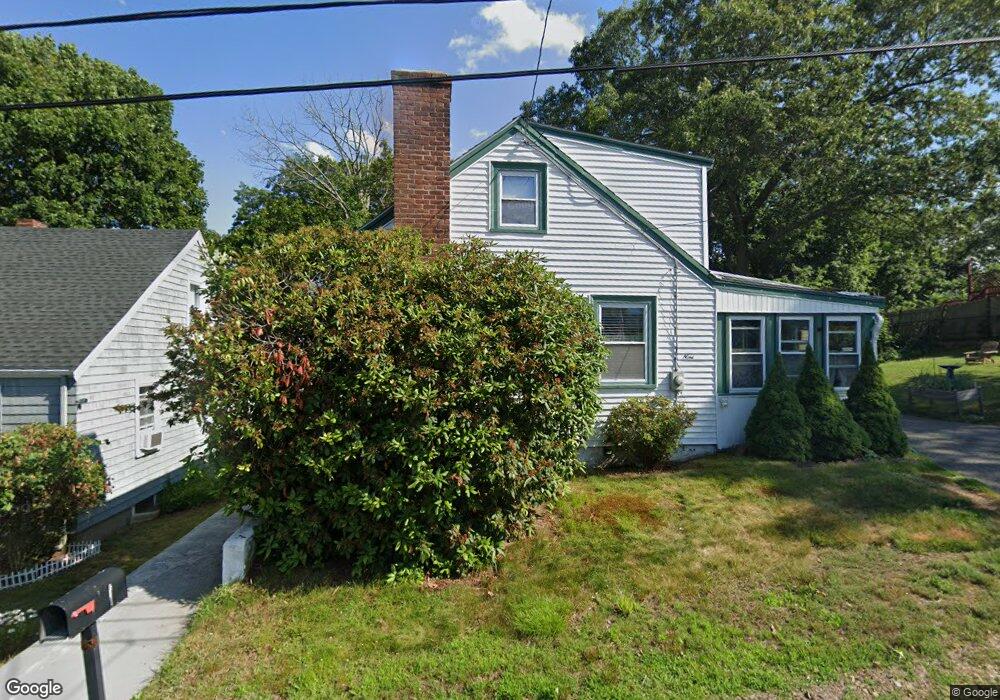
9 Cedarview St Salem, MA 01970
Vinnin Square NeighborhoodEstimated Value: $598,000 - $630,000
3
Beds
2
Baths
1,138
Sq Ft
$535/Sq Ft
Est. Value
About This Home
This home is located at 9 Cedarview St, Salem, MA 01970 and is currently estimated at $609,335, approximately $535 per square foot. 9 Cedarview St is a home located in Essex County with nearby schools including Saltonstall School, Horace Mann Laboratory, and Witchcraft Heights Elementary School.
Ownership History
Date
Name
Owned For
Owner Type
Purchase Details
Closed on
Aug 16, 2004
Sold by
Buckley Cheryl A and Theriault Mary Ellen
Bought by
Boutin Karen
Current Estimated Value
Home Financials for this Owner
Home Financials are based on the most recent Mortgage that was taken out on this home.
Original Mortgage
$240,000
Outstanding Balance
$120,275
Interest Rate
6.16%
Mortgage Type
Purchase Money Mortgage
Estimated Equity
$489,060
Create a Home Valuation Report for This Property
The Home Valuation Report is an in-depth analysis detailing your home's value as well as a comparison with similar homes in the area
Home Values in the Area
Average Home Value in this Area
Purchase History
| Date | Buyer | Sale Price | Title Company |
|---|---|---|---|
| Boutin Karen | $300,000 | -- |
Source: Public Records
Mortgage History
| Date | Status | Borrower | Loan Amount |
|---|---|---|---|
| Open | Boutin Karen | $240,000 |
Source: Public Records
Tax History
| Year | Tax Paid | Tax Assessment Tax Assessment Total Assessment is a certain percentage of the fair market value that is determined by local assessors to be the total taxable value of land and additions on the property. | Land | Improvement |
|---|---|---|---|---|
| 2025 | $5,777 | $509,400 | $211,700 | $297,700 |
| 2024 | $5,775 | $497,000 | $211,700 | $285,300 |
| 2023 | $5,548 | $443,500 | $193,700 | $249,800 |
| 2022 | $5,527 | $417,100 | $186,500 | $230,600 |
| 2021 | $5,357 | $388,200 | $186,500 | $201,700 |
| 2020 | $5,362 | $371,100 | $175,800 | $195,300 |
| 2019 | $5,341 | $353,700 | $167,200 | $186,500 |
| 2018 | $5,126 | $333,300 | $159,300 | $174,000 |
| 2017 | $5,010 | $315,900 | $150,700 | $165,200 |
| 2016 | $4,668 | $297,900 | $132,700 | $165,200 |
| 2015 | $4,534 | $276,300 | $122,000 | $154,300 |
Source: Public Records
Map
Nearby Homes
- 469 Loring Ave
- 28 Surrey Rd
- 1008 Paradise Rd Unit 1M
- 11 Angenica Terrace
- 8 Russell Dr Unit 7D
- 1002 Paradise Rd Unit PHE
- 1004 Paradise Rd Unit 1K
- 1004 Paradise Rd Unit 1L
- 49 Weatherly Dr
- 30 Weatherly Dr
- 11 Weatherly Dr
- 23 Marion Rd Unit B
- 212 Humphrey St Unit 205
- 441 Essex St Unit 302
- 445 Essex St Unit 304
- 106 Broadway Unit 3
- 12 Pickwick Rd
- 16 Pickwick Rd
- 4 Fairview Rd
- 79 Lawrence St
- 5 Cedarview St
- 11 Cedarview St
- 430 Loring Ave
- 426 Loring Ave
- 440 Loring Ave
- 8 Cedarview St
- 13 Cedarview St
- 6 Cedarview St
- 414 Loring Ave
- 10 Cedarview St
- 3 Cedarview St
- 446 Loring Ave
- 1 Riverview Ave
- 12 Cedarview St
- 15 Cedarview St
- 412 Loring Ave
- 1 Riverview St
- 2 Cedarview St
- 450 Loring Ave
- 410 Loring Ave
Your Personal Tour Guide
Ask me questions while you tour the home.