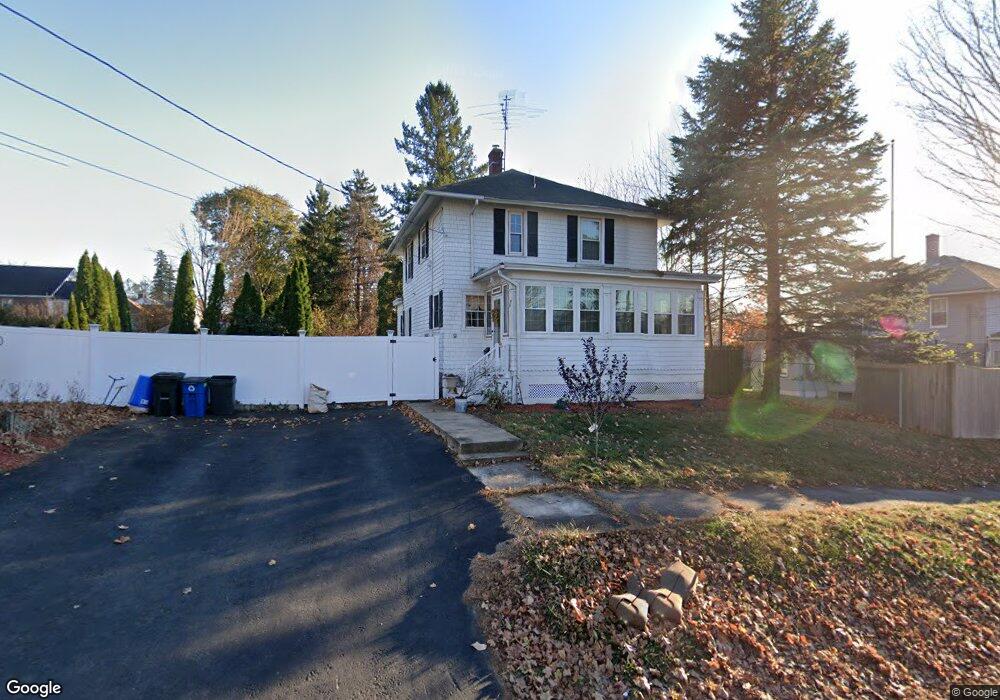
9 Chadwick St North Andover, MA 01845
Estimated Value: $615,000 - $743,000
3
Beds
1
Bath
1,342
Sq Ft
$492/Sq Ft
Est. Value
About This Home
This home is located at 9 Chadwick St, North Andover, MA 01845 and is currently estimated at $660,811, approximately $492 per square foot. 9 Chadwick St is a home located in Essex County with nearby schools including Thomson Elementary School, North Andover Middle School, and North Andover High School.
Ownership History
Date
Name
Owned For
Owner Type
Purchase Details
Closed on
Oct 1, 1998
Sold by
Roy Ronald A
Bought by
Durning Thomas F
Current Estimated Value
Home Financials for this Owner
Home Financials are based on the most recent Mortgage that was taken out on this home.
Original Mortgage
$181,900
Interest Rate
6.89%
Mortgage Type
Purchase Money Mortgage
Create a Home Valuation Report for This Property
The Home Valuation Report is an in-depth analysis detailing your home's value as well as a comparison with similar homes in the area
Home Values in the Area
Average Home Value in this Area
Purchase History
| Date | Buyer | Sale Price | Title Company |
|---|---|---|---|
| Durning Thomas F | $192,000 | -- |
Source: Public Records
Mortgage History
| Date | Status | Borrower | Loan Amount |
|---|---|---|---|
| Open | Durning Thomas F | $206,250 | |
| Closed | Durning Thomas F | $181,900 | |
| Previous Owner | Durning Thomas F | $34,000 |
Source: Public Records
Tax History Compared to Growth
Tax History
| Year | Tax Paid | Tax Assessment Tax Assessment Total Assessment is a certain percentage of the fair market value that is determined by local assessors to be the total taxable value of land and additions on the property. | Land | Improvement |
|---|---|---|---|---|
| 2025 | $5,779 | $513,200 | $297,800 | $215,400 |
| 2024 | $5,434 | $490,000 | $280,300 | $209,700 |
| 2023 | $5,377 | $439,300 | $257,500 | $181,800 |
| 2022 | $5,329 | $393,900 | $231,200 | $162,700 |
| 2021 | $5,111 | $360,700 | $210,200 | $150,500 |
| 2020 | $4,956 | $360,700 | $210,200 | $150,500 |
| 2019 | $5,006 | $373,300 | $210,200 | $163,100 |
| 2018 | $5,424 | $373,300 | $210,200 | $163,100 |
| 2017 | $4,624 | $323,800 | $172,200 | $151,600 |
| 2016 | $4,594 | $321,900 | $169,000 | $152,900 |
| 2015 | $4,252 | $295,500 | $163,200 | $132,300 |
Source: Public Records
Map
Nearby Homes
- 62 Brightwood Ave
- 385 Sutton St
- 29 Brightwood Ave
- 148 Main St Unit A508
- 148 Main St Unit C538
- 148 Main St Unit A307
- 826 Osgood St
- 12 Walker Rd Unit 6
- 64 2nd St
- 68 Belmont St Unit 68
- 0 Great Pond Rd
- 68 Union St
- 13 Woodland St
- 127 Marblehead St Unit A
- 75 Beverly St Unit 75
- 52 Howard St
- 11 W Bradstreet Rd
- 7 Stevens Ct
- 33 Herrick Rd
- 8 Little Rd
- 19 Chadwick St
- 217 High St
- 66 Brightwood Ave
- 213 High St
- 213 High St
- 213 High St Unit 213
- 335 Sutton St
- 203 High St
- 343 Sutton St
- 29 Chadwick St Unit 2
- 27 Chadwick St
- 27 Chadwick St Unit 1
- 27 Chadwick St Unit 2
- 58 Brightwood Ave
- 206 High St Unit 208
- 197 High St
- 67 Brightwood Ave
- 65 Brightwood Ave Unit 67
- 65 Brightwood Ave Unit 1
- 355 Sutton St