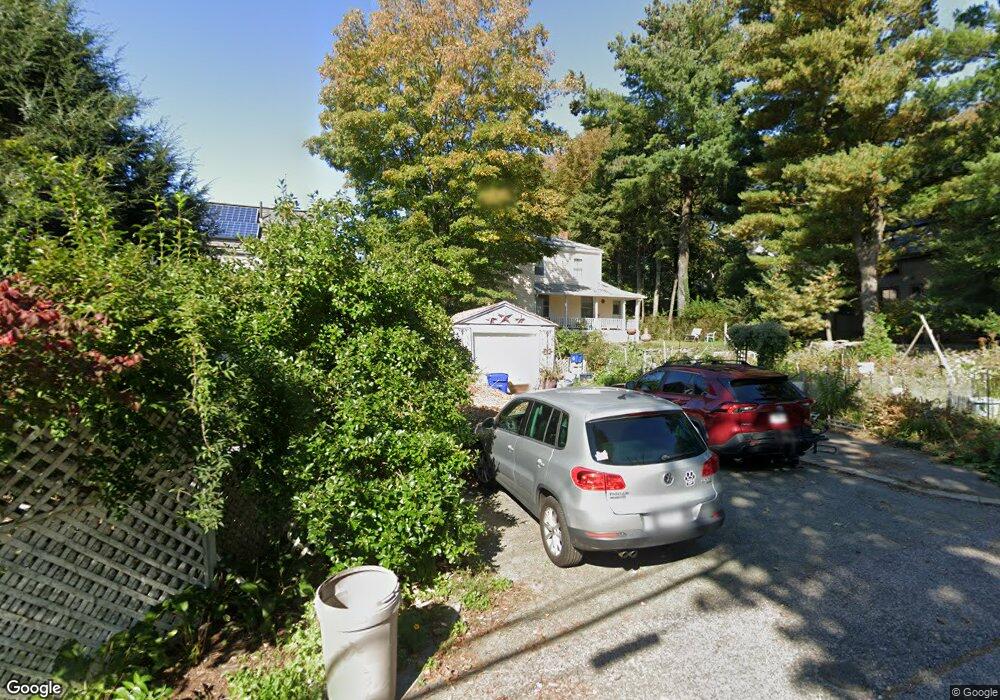
9 Chilton Place Unit 11 Newton Upper Falls, MA 02464
Newton Upper Falls NeighborhoodEstimated Value: $1,051,000 - $1,420,000
2
Beds
1
Bath
1,115
Sq Ft
$1,079/Sq Ft
Est. Value
About This Home
This home is located at 9 Chilton Place Unit 11, Newton Upper Falls, MA 02464 and is currently estimated at $1,202,781, approximately $1,078 per square foot. 9 Chilton Place Unit 11 is a home located in Middlesex County with nearby schools including Angier Elementary School, Zervas Elementary School, and Charles E Brown Middle School.
Ownership History
Date
Name
Owned For
Owner Type
Purchase Details
Closed on
Sep 16, 2008
Sold by
Stewart Abdulaziz and Stewart Derrick A
Bought by
Ross Clarence B and Ross Eleanor S
Current Estimated Value
Purchase Details
Closed on
May 17, 1996
Sold by
Shukhman Anna and Surakov Ilya
Bought by
Stewart Derrick and Stewart Susan E
Purchase Details
Closed on
Jan 27, 1995
Sold by
Ritter Virginia C
Bought by
Ross Clarence B and Ross Eleanor
Purchase Details
Closed on
Aug 31, 1994
Sold by
Ritter Virginia C and Heath Catherine M
Bought by
Shukhman Anna and Surakov Ilya
Purchase Details
Closed on
Jun 13, 1991
Sold by
Hutchinson Alan W and Hutchinson Jean W
Bought by
Ritter Virginia C and Heath Catherine M
Create a Home Valuation Report for This Property
The Home Valuation Report is an in-depth analysis detailing your home's value as well as a comparison with similar homes in the area
Home Values in the Area
Average Home Value in this Area
Purchase History
| Date | Buyer | Sale Price | Title Company |
|---|---|---|---|
| Ross Clarence B | $285,000 | -- | |
| Stewart Derrick | $136,000 | -- | |
| Ross Clarence B | $139,000 | -- | |
| Shukhman Anna | $135,000 | -- | |
| Ritter Virginia C | $205,000 | -- |
Source: Public Records
Mortgage History
| Date | Status | Borrower | Loan Amount |
|---|---|---|---|
| Open | Ritter Virginia C | $100,000 | |
| Open | Ritter Virginia C | $306,500 | |
| Closed | Ritter Virginia C | $300,000 |
Source: Public Records
Tax History Compared to Growth
Tax History
| Year | Tax Paid | Tax Assessment Tax Assessment Total Assessment is a certain percentage of the fair market value that is determined by local assessors to be the total taxable value of land and additions on the property. | Land | Improvement |
|---|---|---|---|---|
| 2025 | $7,870 | $803,100 | $699,700 | $103,400 |
| 2024 | $7,610 | $779,700 | $679,300 | $100,400 |
| 2023 | $7,275 | $714,600 | $538,600 | $176,000 |
| 2022 | $6,961 | $661,700 | $498,700 | $163,000 |
| 2021 | $6,532 | $607,100 | $457,500 | $149,600 |
| 2020 | $6,338 | $607,100 | $457,500 | $149,600 |
| 2019 | $5,929 | $567,400 | $427,600 | $139,800 |
| 2018 | $5,847 | $540,400 | $401,700 | $138,700 |
| 2017 | $5,513 | $495,800 | $368,500 | $127,300 |
| 2016 | $5,177 | $454,900 | $338,100 | $116,800 |
| 2015 | $4,935 | $425,100 | $316,000 | $109,100 |
Source: Public Records
Map
Nearby Homes
- 66 Rockland Place
- 992 Chestnut St
- 1003 Chestnut St
- 989 Chestnut St Unit 8
- 103 Thurston Rd
- 51 Pettee St Unit 11
- 102 Thurston Rd Unit 100
- 300 Elliot St Unit 300
- 45 River Ave Unit 45
- 873 Chestnut St
- 27 Hamilton Place
- 20 Pennsylvania Ave
- 20 Pennsylvania Ave Unit 20
- 18-20 Pennsylvania Ave Unit 18
- 131 Oliver Rd
- 17 Circuit Ave Unit 2
- 12 Shawmut Park
- 27 Indiana Terrace Unit 29
- 120 Stanley Rd
- 54 Indiana Terrace
- 11 Chilton Place
- 9 Chilton Place
- 17 Chilton Place
- 15 Chilton Place
- 17 Chilton Place Unit 2
- 15 Chilton Place Unit 1
- 17 Chilton Place Unit 17
- 91 High St
- 87 Rockland Place
- 99 High St
- 103 High St
- 85 High St
- 109 High St
- 73 Rockland Place
- 83 High St Unit 83A
- 83 High St
- 35 Lucille Place
- 31 Lucille Place
- 31 Lucille Place Unit 31
- 31 Lucille Place