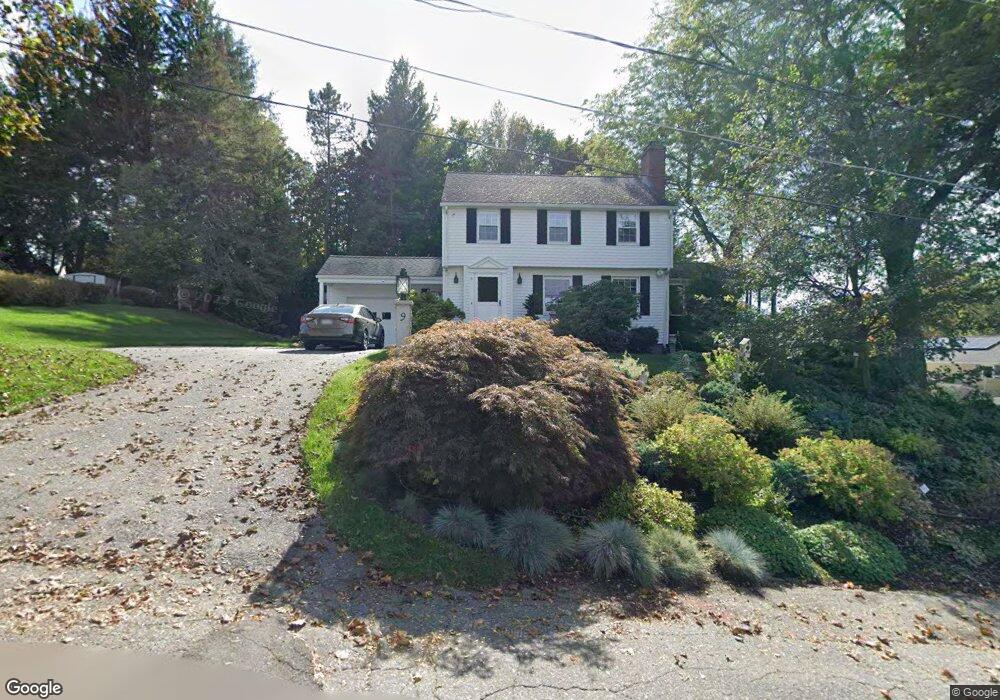
9 Chipman St Clinton, MA 01510
Estimated Value: $501,565 - $544,000
About This Home
This home is located at 9 Chipman St, Clinton, MA 01510 and is currently estimated at $519,641, approximately $286 per square foot. 9 Chipman St is a home located in Worcester County with nearby schools including Clinton Elementary School, Clinton Senior High School, and Clinton Middle School.
Ownership History
We collect this data history from publicly available records. To have your information removed, we recommend requesting removal directly through your county’s website.
Purchase Details
Home Financials for this Owner
Home Financials are based on the most recent Mortgage that was taken out on this home.Home Values in the Area
Average Home Value in this Area
Purchase History
We collect this data history from publicly available records. To have your information removed, we recommend requesting removal directly through your county’s website.
| Date | Buyer | Sale Price | Title Company |
|---|---|---|---|
| -- | -- |
Mortgage History
We collect this data history from publicly available records. To have your information removed, we recommend requesting removal directly through your county’s website.
| Date | Status | Borrower | Loan Amount |
|---|---|---|---|
| Open | $75,000 |
Tax History
We collect this data history from publicly available records. To have your information removed, we recommend requesting removal directly through your county’s website.
| Year | Tax Paid | Tax Assessment Tax Assessment Total Assessment is a certain percentage of the fair market value that is determined by local assessors to be the total taxable value of land and additions on the property. | Land | Improvement |
|---|---|---|---|---|
| 2025 | $5,883 | $442,300 | $125,300 | $317,000 |
| 2024 | $5,776 | $439,600 | $125,300 | $314,300 |
| 2023 | $5,415 | $405,000 | $113,800 | $291,200 |
| 2022 | $5,312 | $356,300 | $103,500 | $252,800 |
| 2021 | $4,548 | $285,300 | $98,600 | $186,700 |
| 2020 | $4,419 | $285,300 | $98,600 | $186,700 |
| 2019 | $4,416 | $277,200 | $95,700 | $181,500 |
| 2018 | $4,415 | $260,000 | $95,700 | $164,300 |
| 2017 | $4,167 | $235,800 | $95,700 | $140,100 |
| 2016 | $4,129 | $239,100 | $95,700 | $143,400 |
| 2015 | $3,760 | $225,700 | $93,000 | $132,700 |
| 2014 | $3,645 | $225,700 | $93,000 | $132,700 |
Map
- 11 Cromie St
- 212 Chace St
- 349 Oak St
- 10 Horseshoe Ln
- 11 Lindbergh Street Rear
- 402 Ridgefield Cir Unit D
- 216 Walnut St
- 610 Ridgefield Cir Unit D
- 600 Ridgefield Cir Unit A
- 65 Pearl St
- 115117 Mechanic St Unit 4
- 115117 Mechanic St
- 115117 Mechanic St Unit 3
- 19 Brendan Rd
- 129 High St
- 25 Collins Rd
- 18 Eagle Nest Unit 444
- 11 Eileen Ave
- 508 High St
- 40 Nashua St Unit 3
Ask me questions while you tour the home.