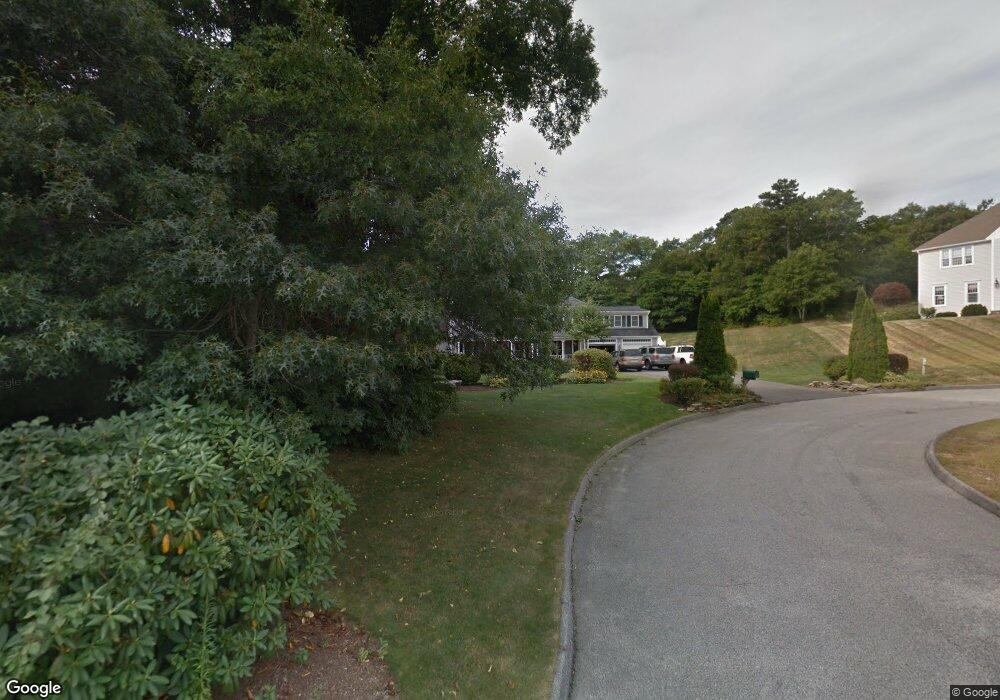
9 Clapp Ln Unit 1-1 Sagamore Beach, MA 02562
Estimated Value: $1,075,000 - $1,137,000
4
Beds
5
Baths
3,914
Sq Ft
$284/Sq Ft
Est. Value
About This Home
This home is located at 9 Clapp Ln Unit 1-1, Sagamore Beach, MA 02562 and is currently estimated at $1,111,371, approximately $283 per square foot. 9 Clapp Ln Unit 1-1 is a home located in Barnstable County with nearby schools including Bourne High School, New Testament Christian School, and Bridgeview Montessori School.
Ownership History
Date
Name
Owned For
Owner Type
Purchase Details
Closed on
Oct 10, 2024
Sold by
Stonebat Llc
Bought by
Toomey Carol M
Current Estimated Value
Purchase Details
Closed on
May 29, 2015
Sold by
Toomey Carol M
Bought by
Stonebat Llc
Purchase Details
Closed on
Feb 27, 2008
Sold by
Quinn Francis J and Finlay Rodney
Bought by
Toomey Carol M
Home Financials for this Owner
Home Financials are based on the most recent Mortgage that was taken out on this home.
Original Mortgage
$333,000
Interest Rate
5.8%
Mortgage Type
Purchase Money Mortgage
Purchase Details
Closed on
Aug 17, 1994
Sold by
Earles Rt and Clapp Roger E
Bought by
Doherty Richard J and Doherty Christine M
Create a Home Valuation Report for This Property
The Home Valuation Report is an in-depth analysis detailing your home's value as well as a comparison with similar homes in the area
Home Values in the Area
Average Home Value in this Area
Purchase History
| Date | Buyer | Sale Price | Title Company |
|---|---|---|---|
| Toomey Carol M | -- | None Available | |
| Toomey Carol M | -- | None Available | |
| Stonebat Llc | -- | -- | |
| Toomey Carol M | $444,000 | -- | |
| Doherty Richard J | $45,000 | -- | |
| Stonebat Llc | -- | -- | |
| Toomey Carol M | $444,000 | -- | |
| Doherty Richard J | $45,000 | -- |
Source: Public Records
Mortgage History
| Date | Status | Borrower | Loan Amount |
|---|---|---|---|
| Previous Owner | Doherty Richard J | $317,000 | |
| Previous Owner | Toomey Carol M | $333,000 | |
| Previous Owner | Doherty Richard J | $147,700 |
Source: Public Records
Tax History Compared to Growth
Tax History
| Year | Tax Paid | Tax Assessment Tax Assessment Total Assessment is a certain percentage of the fair market value that is determined by local assessors to be the total taxable value of land and additions on the property. | Land | Improvement |
|---|---|---|---|---|
| 2025 | $7,593 | $972,200 | $252,400 | $719,800 |
| 2024 | $7,490 | $933,900 | $240,400 | $693,500 |
| 2023 | $7,282 | $826,600 | $212,800 | $613,800 |
| 2022 | $6,817 | $675,600 | $188,300 | $487,300 |
| 2021 | $3,684 | $620,200 | $171,300 | $448,900 |
| 2020 | $3,757 | $612,800 | $169,700 | $443,100 |
| 2019 | $3,577 | $592,600 | $169,700 | $422,900 |
| 2018 | $5,509 | $522,700 | $161,700 | $361,000 |
| 2017 | $3,111 | $539,000 | $160,100 | $378,900 |
| 2016 | $5,378 | $529,300 | $160,100 | $369,200 |
| 2015 | -- | $514,800 | $145,600 | $369,200 |
Source: Public Records
Map
Nearby Homes
- 19 Oak Bluff Rd
- 11 Village Green Dr Unit B
- 20 Brady Rd
- 368 Old Plymouth Rd
- 29 Sheppard Rd
- 5 Oakwood Dr
- 5 Pocasset Rd
- 10 Tecumseh Rd
- 0 State Rd
- 133 Phillips Rd
- 48 Menotomy Rd
- 15 Nonantum Rd
- 18 Ocean Pines Dr Unit A
- 1 Kara's Way
- 16 Ocean Pines Dr Unit B
- 92 Cliffside Dr Unit hole 2
- 67 Phillips Rd
- 67 Phillips Rd
- 53 White Cliff Dr
- 1150 Long Pond Rd