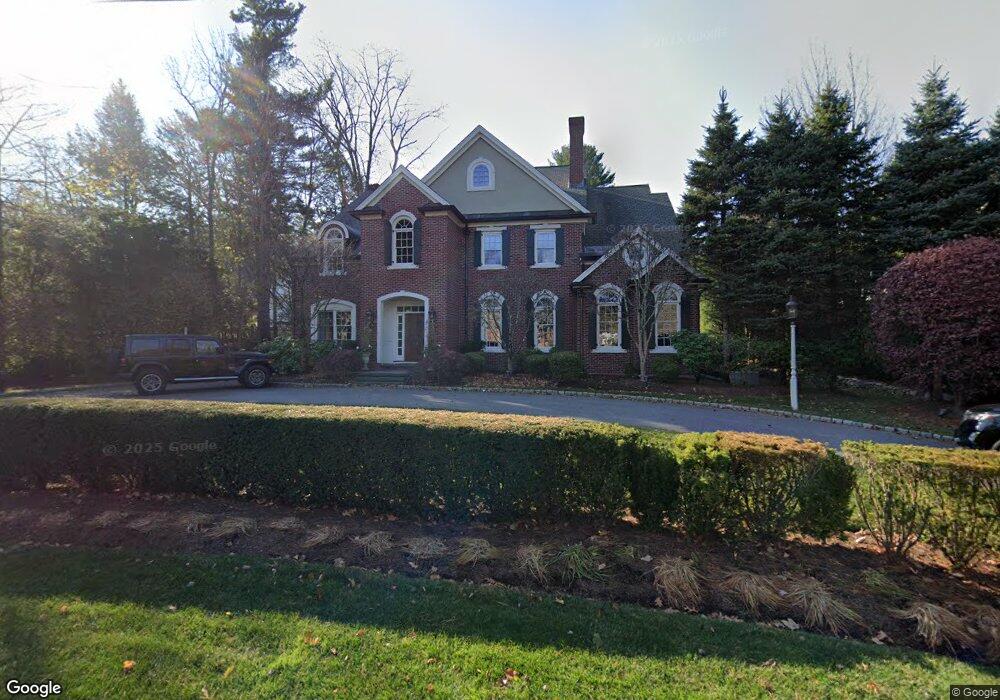
9 Clark Rd Wellesley Hills, MA 02481
Estimated Value: $4,317,931 - $5,302,000
5
Beds
6
Baths
5,700
Sq Ft
$857/Sq Ft
Est. Value
About This Home
This home is located at 9 Clark Rd, Wellesley Hills, MA 02481 and is currently estimated at $4,882,983, approximately $856 per square foot. 9 Clark Rd is a home located in Norfolk County with nearby schools including Joseph E. Fiske Elementary School, Wellesley Middle School, and Wellesley Sr High School.
Ownership History
Date
Name
Owned For
Owner Type
Purchase Details
Closed on
Feb 1, 2002
Sold by
Behrend Dean F
Bought by
Slifka Eric S
Current Estimated Value
Home Financials for this Owner
Home Financials are based on the most recent Mortgage that was taken out on this home.
Original Mortgage
$650,000
Interest Rate
7.15%
Mortgage Type
Purchase Money Mortgage
Purchase Details
Closed on
May 15, 1998
Sold by
Trifiro Tr Richard J
Bought by
Zink Joseph L
Create a Home Valuation Report for This Property
The Home Valuation Report is an in-depth analysis detailing your home's value as well as a comparison with similar homes in the area
Purchase History
| Date | Buyer | Sale Price | Title Company |
|---|---|---|---|
| Slifka Eric S | $2,300,000 | -- | |
| Slifka Eric S | $2,300,000 | -- | |
| Zink Joseph L | $96,900 | -- |
Source: Public Records
Mortgage History
| Date | Status | Borrower | Loan Amount |
|---|---|---|---|
| Open | Zink Joseph L | $417,000 | |
| Closed | Slifka Eric S | $650,000 | |
| Previous Owner | Zink Joseph L | $600,000 |
Source: Public Records
Tax History
| Year | Tax Paid | Tax Assessment Tax Assessment Total Assessment is a certain percentage of the fair market value that is determined by local assessors to be the total taxable value of land and additions on the property. | Land | Improvement |
|---|---|---|---|---|
| 2025 | $35,630 | $3,466,000 | $1,380,000 | $2,086,000 |
| 2024 | $33,208 | $3,190,000 | $1,380,000 | $1,810,000 |
| 2023 | $32,564 | $2,844,000 | $1,231,000 | $1,613,000 |
| 2022 | $31,045 | $2,658,000 | $1,103,000 | $1,555,000 |
| 2021 | $30,339 | $2,582,000 | $1,027,000 | $1,555,000 |
| 2020 | $29,848 | $2,582,000 | $1,027,000 | $1,555,000 |
| 2019 | $30,313 | $2,620,000 | $1,065,000 | $1,555,000 |
| 2018 | $29,803 | $2,494,000 | $883,000 | $1,611,000 |
| 2017 | $26,351 | $2,235,000 | $882,000 | $1,353,000 |
| 2016 | $27,114 | $2,292,000 | $867,000 | $1,425,000 |
| 2015 | $26,507 | $2,293,000 | $868,000 | $1,425,000 |
Source: Public Records
Map
Nearby Homes
Your Personal Tour Guide
Ask me questions while you tour the home.