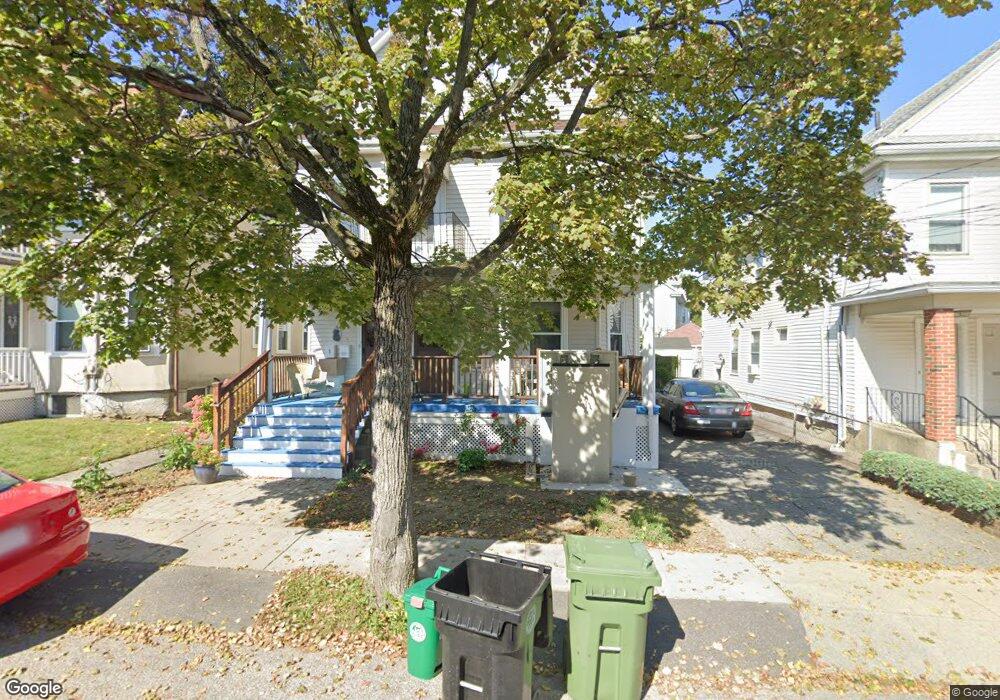
9 Clayton St Unit 11 Watertown, MA 02472
East Watertown NeighborhoodEstimated Value: $579,000 - $622,543
5
Beds
3
Baths
2,735
Sq Ft
$219/Sq Ft
Est. Value
About This Home
This home is located at 9 Clayton St Unit 11, Watertown, MA 02472 and is currently estimated at $598,386, approximately $218 per square foot. 9 Clayton St Unit 11 is a home located in Middlesex County with nearby schools including St. Stephen's Armenian Elementary School, Atrium School, and The Kendall School.
Ownership History
Date
Name
Owned For
Owner Type
Purchase Details
Closed on
Jan 31, 2024
Sold by
Hanawalt Larry A and Perrin Kathryn L
Bought by
Perrin Hanawalt 2024 T and Perrin Hanawalt
Current Estimated Value
Purchase Details
Closed on
Aug 3, 2021
Sold by
Mcneely Thomas H
Bought by
Hanawalt Larry A and Perrin Kathryn L
Home Financials for this Owner
Home Financials are based on the most recent Mortgage that was taken out on this home.
Original Mortgage
$460,350
Interest Rate
2.93%
Mortgage Type
VA
Purchase Details
Closed on
Jan 11, 2019
Sold by
Mcneely Thomas H and Mcgrath Cheryl E
Bought by
Mcneely Thomas H
Home Financials for this Owner
Home Financials are based on the most recent Mortgage that was taken out on this home.
Original Mortgage
$260,000
Interest Rate
4.6%
Mortgage Type
New Conventional
Create a Home Valuation Report for This Property
The Home Valuation Report is an in-depth analysis detailing your home's value as well as a comparison with similar homes in the area
Home Values in the Area
Average Home Value in this Area
Purchase History
| Date | Buyer | Sale Price | Title Company |
|---|---|---|---|
| Perrin Hanawalt 2024 T | -- | None Available | |
| Hanawalt Larry A | $450,000 | None Available | |
| Mcneely Thomas H | -- | None Available | |
| Mcgrath Cheryl E | -- | None Available |
Source: Public Records
Mortgage History
| Date | Status | Borrower | Loan Amount |
|---|---|---|---|
| Previous Owner | Hanawalt Larry A | $460,350 | |
| Previous Owner | Mcgrath Cheryl E | $260,000 | |
| Previous Owner | Mcneely Thomas H | $103,000 |
Source: Public Records
Tax History Compared to Growth
Tax History
| Year | Tax Paid | Tax Assessment Tax Assessment Total Assessment is a certain percentage of the fair market value that is determined by local assessors to be the total taxable value of land and additions on the property. | Land | Improvement |
|---|---|---|---|---|
| 2025 | $5,502 | $471,100 | $0 | $471,100 |
| 2024 | $6,015 | $514,100 | $0 | $514,100 |
| 2023 | $6,717 | $494,600 | $0 | $494,600 |
| 2022 | $5,953 | $449,300 | $0 | $449,300 |
| 2021 | $5,546 | $452,700 | $0 | $452,700 |
| 2020 | $4,548 | $374,600 | $0 | $374,600 |
Source: Public Records
Map
Nearby Homes
- 1 Clayton St
- 43 Irma Ave Unit 43
- 81 Winsor Ave
- 56-58 Edgecliff Rd
- 87 Templeton Pkwy Unit 3
- 238 Arlington St Unit 238
- 133 Hillside Rd
- 85 Dexter Ave Unit 87
- 85 Dexter Ave
- 57 Quimby St
- 163 Belmont St
- 276 Belmont St Unit 1
- 10 Marlboro St Unit 1
- 16 Ericsson St
- 25 Francis St Unit 2
- 25 Francis St Unit 1
- 154 Cypress St
- 30 Unity Ave Unit 30
- 84 Boylston St
- 73 Foster Rd Unit 2
- 11 Clayton St Unit 11
- 11 Clayton St
- 57 Clayton St
- 5-7 Clayton St Unit 1
- 5-7 Clayton St
- 5 Clayton St
- 15 Clayton St Unit FIRST FLOOR
- 15 Clayton St
- 15 Clayton St Unit 1
- 13 Clayton St Unit 15
- 1-3 Clayton St
- 3 Clayton St
- 37 Rangeley Rd
- 23 Appleton St
- 35 Lloyd Rd
- 35 Lloyd Rd Unit 2
- 17 Appleton St
- 15 Appleton St
- 11 Appleton St
- 11 Appleton St Unit 1