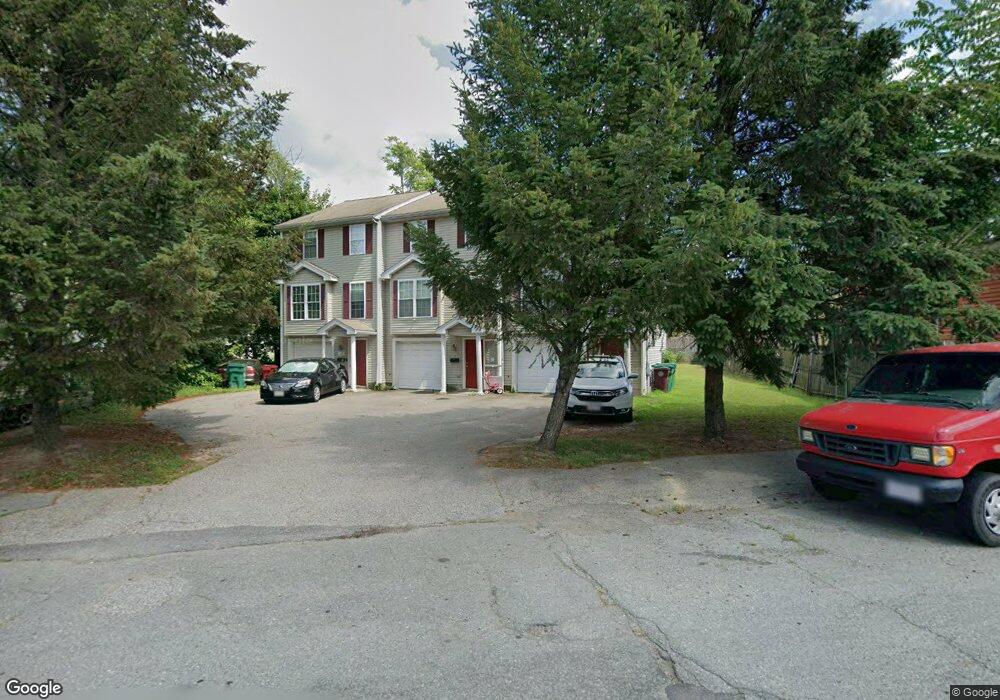
9 Coburn St Unit A Lowell, MA 01850
Centralville NeighborhoodEstimated Value: $308,000 - $363,437
2
Beds
2
Baths
1,014
Sq Ft
$333/Sq Ft
Est. Value
About This Home
This home is located at 9 Coburn St Unit A, Lowell, MA 01850 and is currently estimated at $337,359, approximately $332 per square foot. 9 Coburn St Unit A is a home located in Middlesex County with nearby schools including Greenhalge Elementary School, S. Christa McAuliffe Elementary School, and Moody Elementary School.
Ownership History
Date
Name
Owned For
Owner Type
Purchase Details
Closed on
Jun 30, 2009
Sold by
Sovereign Bk
Bought by
Tringale Mark
Current Estimated Value
Home Financials for this Owner
Home Financials are based on the most recent Mortgage that was taken out on this home.
Original Mortgage
$1,769
Outstanding Balance
$1,131
Interest Rate
4.92%
Mortgage Type
Purchase Money Mortgage
Estimated Equity
$336,228
Purchase Details
Closed on
Dec 30, 2008
Sold by
Pires Soraia V and Sovereign Bk
Bought by
Sovereign Bk
Purchase Details
Closed on
May 1, 2007
Sold by
Pires Soraia V
Bought by
Dutra Edivaldo Ramos
Purchase Details
Closed on
Apr 28, 2003
Sold by
Coburn St Llc
Bought by
Santiago David and Santiago Lumaris
Home Financials for this Owner
Home Financials are based on the most recent Mortgage that was taken out on this home.
Original Mortgage
$156,275
Interest Rate
5.64%
Mortgage Type
Purchase Money Mortgage
Create a Home Valuation Report for This Property
The Home Valuation Report is an in-depth analysis detailing your home's value as well as a comparison with similar homes in the area
Home Values in the Area
Average Home Value in this Area
Purchase History
| Date | Buyer | Sale Price | Title Company |
|---|---|---|---|
| Tringale Mark | $124,900 | -- | |
| Sovereign Bk | $140,000 | -- | |
| Dutra Edivaldo Ramos | -- | -- | |
| Santiago David | $164,500 | -- |
Source: Public Records
Mortgage History
| Date | Status | Borrower | Loan Amount |
|---|---|---|---|
| Open | Tringale Mark | $1,769 | |
| Previous Owner | Santiago David | $156,275 |
Source: Public Records
Tax History Compared to Growth
Tax History
| Year | Tax Paid | Tax Assessment Tax Assessment Total Assessment is a certain percentage of the fair market value that is determined by local assessors to be the total taxable value of land and additions on the property. | Land | Improvement |
|---|---|---|---|---|
| 2025 | $3,272 | $285,000 | $0 | $285,000 |
| 2024 | $3,081 | $258,700 | $0 | $258,700 |
| 2023 | $2,973 | $239,400 | $0 | $239,400 |
| 2022 | $2,822 | $222,400 | $0 | $222,400 |
| 2021 | $2,680 | $199,100 | $0 | $199,100 |
| 2020 | $2,574 | $192,700 | $0 | $192,700 |
| 2019 | $2,512 | $178,900 | $0 | $178,900 |
| 2018 | $2,416 | $167,900 | $0 | $167,900 |
| 2017 | $2,359 | $158,100 | $0 | $158,100 |
| 2016 | $2,263 | $149,300 | $0 | $149,300 |
| 2015 | $2,200 | $142,100 | $0 | $142,100 |
| 2013 | $2,160 | $143,900 | $0 | $143,900 |
Source: Public Records
Map
Nearby Homes
- 76 W 3rd St
- 49 Coburn St
- 57 Lakeview Ave
- 45 W 4th St
- 41 W L St
- 130 John St Unit G01
- 130 John St Unit 242
- 130 John St Unit 455
- 11 Hampshire St
- 27 4th St
- 35 W 9th St
- 8 Read St
- 94 1st St Unit 10
- 17 Kearney Square Unit 201
- 17 Kearney Square Unit 205
- 23-33 Middle St Unit 11
- 23-33 Middle St Unit 6
- 23-33 Middle St Unit 17
- 61 Market St Unit 2B
- 172 Middle St Unit 304
- 9 Coburn St Unit B
- 9 Coburn St Unit C
- 171 Lakeview Ave
- 13 Coburn St
- 78 W 3rd St
- 72 W 3rd St Unit 72
- 74 W 3rd St
- 72 W 3rd St Unit 1st fl rear
- 72 W 3rd St Unit 1st fl frnt
- 72 W 3rd St
- 72 W 3rd St Unit 2
- 90 W 3rd St
- 70 W 3rd St
- 68 W 3rd St
- 180 Lakeview Ave
- 162 Lakeview Ave
- 182 Lakeview Ave
- 24 Coburn St
- 172 Lakeview Ave
- 87 W 3rd St