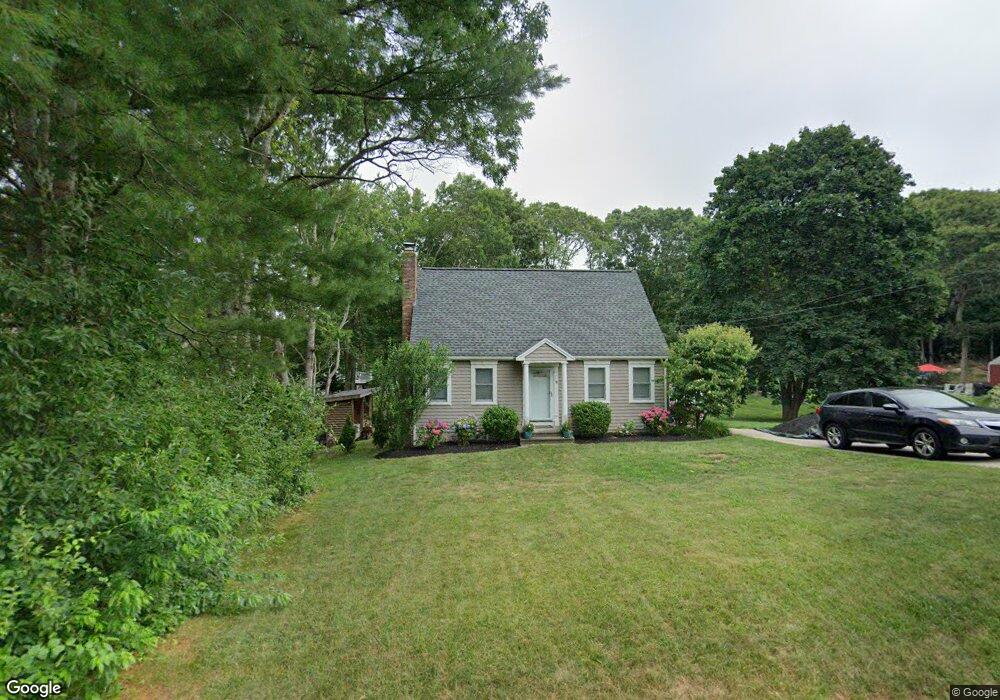
9 Colony Ave Bourne, MA 2532
Estimated Value: $572,000 - $613,000
3
Beds
3
Baths
1,344
Sq Ft
$438/Sq Ft
Est. Value
About This Home
This home is located at 9 Colony Ave, Bourne, MA 2532 and is currently estimated at $588,016, approximately $437 per square foot. 9 Colony Ave is a home located in Barnstable County with nearby schools including Bourne High School, Cadence Academy Preschool - Bourne, and St Margaret Regional School.
Ownership History
Date
Name
Owned For
Owner Type
Purchase Details
Closed on
May 4, 2019
Sold by
Mclane-Ferguson Geoffrey and Ferguson Elizabeth R
Bought by
Lamken Jonathan and Preston Courtney
Current Estimated Value
Home Financials for this Owner
Home Financials are based on the most recent Mortgage that was taken out on this home.
Original Mortgage
$340,000
Outstanding Balance
$296,444
Interest Rate
4%
Mortgage Type
New Conventional
Estimated Equity
$291,572
Purchase Details
Closed on
Jul 31, 2015
Sold by
Travaglione Richard M and Travaglione Adriana
Bought by
Ferguson Geoffrey M and Ferguson Elizabeth R
Purchase Details
Closed on
Apr 16, 2010
Sold by
Lyons Patricia and Walsh Edward F
Bought by
Travaglione Richard M
Home Financials for this Owner
Home Financials are based on the most recent Mortgage that was taken out on this home.
Original Mortgage
$168,000
Interest Rate
4.97%
Mortgage Type
Purchase Money Mortgage
Create a Home Valuation Report for This Property
The Home Valuation Report is an in-depth analysis detailing your home's value as well as a comparison with similar homes in the area
Home Values in the Area
Average Home Value in this Area
Purchase History
| Date | Buyer | Sale Price | Title Company |
|---|---|---|---|
| Lamken Jonathan | $360,000 | -- | |
| Lamken Jonathan | $360,000 | -- | |
| Ferguson Geoffrey M | $308,500 | -- | |
| Ferguson Geoffrey M | $308,500 | -- | |
| Travaglione Richard M | $210,000 | -- | |
| Travaglione Richard M | $210,000 | -- |
Source: Public Records
Mortgage History
| Date | Status | Borrower | Loan Amount |
|---|---|---|---|
| Open | Lamken Jonathan | $340,000 | |
| Closed | Lamken Jonathan | $340,000 | |
| Previous Owner | Travaglione Richard M | $168,000 |
Source: Public Records
Tax History Compared to Growth
Tax History
| Year | Tax Paid | Tax Assessment Tax Assessment Total Assessment is a certain percentage of the fair market value that is determined by local assessors to be the total taxable value of land and additions on the property. | Land | Improvement |
|---|---|---|---|---|
| 2025 | $4,001 | $512,300 | $183,600 | $328,700 |
| 2024 | $3,912 | $487,800 | $174,800 | $313,000 |
| 2023 | $4,468 | $507,100 | $154,700 | $352,400 |
| 2022 | $3,835 | $380,100 | $136,900 | $243,200 |
| 2021 | $3,751 | $348,300 | $124,600 | $223,700 |
| 2020 | $3,512 | $327,000 | $123,400 | $203,600 |
| 2019 | $3,337 | $317,500 | $123,400 | $194,100 |
| 2018 | $3,188 | $302,500 | $117,600 | $184,900 |
| 2017 | $3,025 | $293,700 | $110,600 | $183,100 |
| 2016 | $2,914 | $286,800 | $110,600 | $176,200 |
| 2015 | -- | $239,200 | $99,000 | $140,200 |
Source: Public Records
Map
Nearby Homes
- 2 Westerly Dr
- 16 Tara Terrace
- 93 Valley Bars Rd
- 112 Clay Pond Rd
- 105 Clay Pond Rd
- 18 Quaker Ln
- 30 Howard Ave
- 16 Amberwood Ct
- 12 Beachwood Rd
- 34 Turnberry Rd
- 12 Turnberry Rd Unit 12
- 18 Carlton Rd
- 440 County Rd
- 4 Hollyhock Knoll Ct Unit 4
- 4 Hollyhock Knoll Ct Unit 4
- 501 County Rd
- 203 County Rd
- 1 Hollyhock Knoll Ct Unit 1
- 515 County Rd