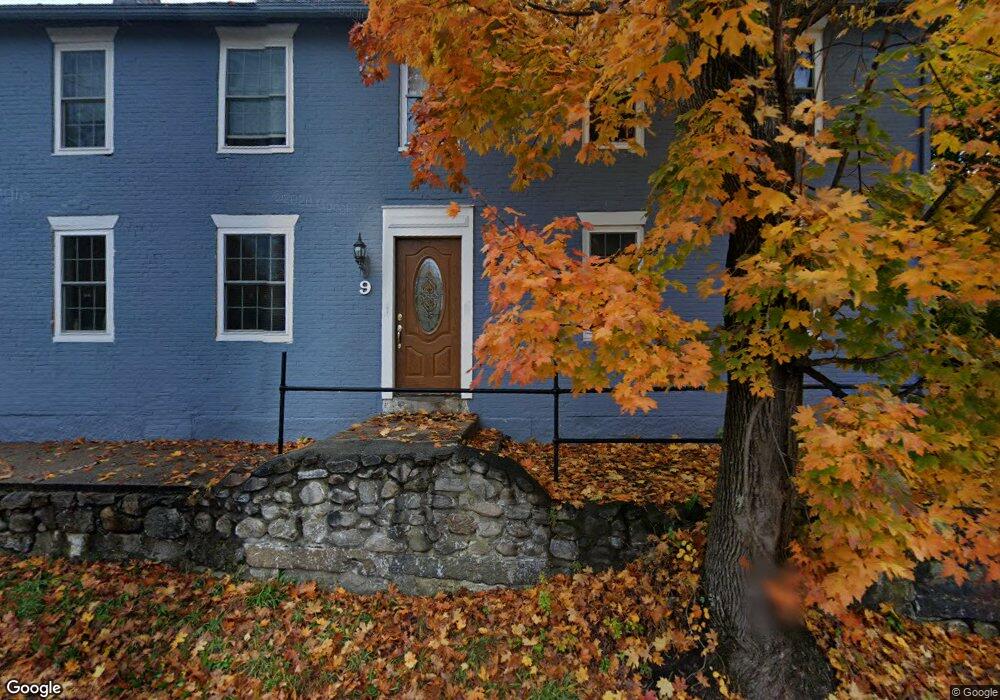
9 Cook St Douglas, MA 01516
Estimated Value: $494,769 - $590,000
4
Beds
2
Baths
2,520
Sq Ft
$222/Sq Ft
Est. Value
About This Home
This home is located at 9 Cook St, Douglas, MA 01516 and is currently estimated at $558,942, approximately $221 per square foot. 9 Cook St is a home located in Worcester County with nearby schools including Douglas Primary School, Douglas Middle School, and Douglas High School.
Ownership History
Date
Name
Owned For
Owner Type
Purchase Details
Closed on
Mar 26, 2021
Sold by
Josey Robert A
Bought by
41 Cook Street Llc
Current Estimated Value
Purchase Details
Closed on
Nov 5, 2012
Sold by
Colonair Sharon A and Gressak Scott
Bought by
Josey Robert A
Home Financials for this Owner
Home Financials are based on the most recent Mortgage that was taken out on this home.
Original Mortgage
$138,750
Interest Rate
4%
Mortgage Type
New Conventional
Create a Home Valuation Report for This Property
The Home Valuation Report is an in-depth analysis detailing your home's value as well as a comparison with similar homes in the area
Home Values in the Area
Average Home Value in this Area
Purchase History
| Date | Buyer | Sale Price | Title Company |
|---|---|---|---|
| 41 Cook Street Llc | -- | None Available | |
| Josey Robert A | $185,000 | -- |
Source: Public Records
Mortgage History
| Date | Status | Borrower | Loan Amount |
|---|---|---|---|
| Previous Owner | Josey Robert A | $138,750 |
Source: Public Records
Tax History
| Year | Tax Paid | Tax Assessment Tax Assessment Total Assessment is a certain percentage of the fair market value that is determined by local assessors to be the total taxable value of land and additions on the property. | Land | Improvement |
|---|---|---|---|---|
| 2025 | $54 | $409,800 | $100,800 | $309,000 |
| 2024 | $5,371 | $397,300 | $96,000 | $301,300 |
| 2023 | $5,243 | $365,100 | $96,000 | $269,100 |
| 2022 | $5,244 | $320,900 | $85,900 | $235,000 |
| 2021 | $5,168 | $309,100 | $81,900 | $227,200 |
| 2020 | $4,807 | $283,100 | $81,900 | $201,200 |
| 2019 | $4,713 | $269,300 | $81,900 | $187,400 |
| 2018 | $4,294 | $267,200 | $81,900 | $185,300 |
| 2017 | $3,934 | $235,300 | $78,500 | $156,800 |
| 2016 | $3,924 | $233,300 | $78,500 | $154,800 |
| 2015 | $3,840 | $233,300 | $78,500 | $154,800 |
Source: Public Records
Map
Nearby Homes
- 11 Cook St
- 1 B St
- 3 B St
- 15 Cook St
- 12 Cook St
- 13 Cook St
- 3 Cook St Unit 5
- 3 Cook St Unit Furnished w/all util
- 3 Cook St Unit 33 Furnished
- 3 Cook St Unit 33
- 3 Cook St Unit 33 Furnished
- 3 Cook St Unit 7
- 3 Cook St Unit 24
- 3 Cook St Unit 44
- 3 Cook St Unit 1 BR Furnished
- 3 Cook St Unit 9
- 3 Cook St
- 3 Cook St
- 3 Cook St Unit 32
- 14 Cook St
Your Personal Tour Guide
Ask me questions while you tour the home.