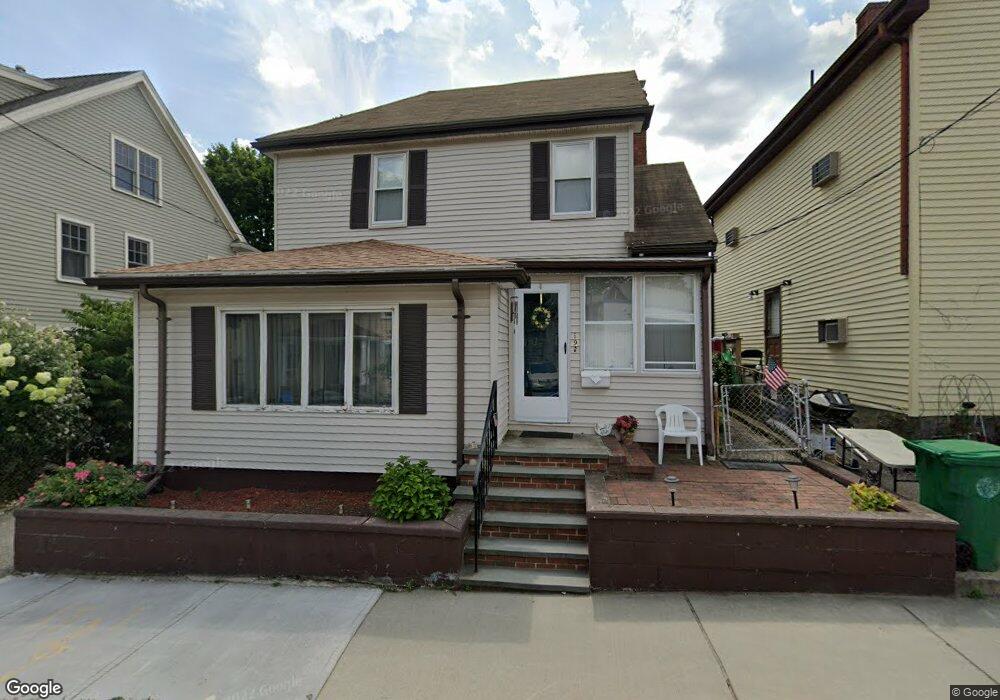
9 Cook St Newton, MA 02458
Nonantum NeighborhoodEstimated Value: $796,000 - $1,104,000
3
Beds
2
Baths
1,862
Sq Ft
$498/Sq Ft
Est. Value
About This Home
This home is located at 9 Cook St, Newton, MA 02458 and is currently estimated at $927,664, approximately $498 per square foot. 9 Cook St is a home located in Middlesex County with nearby schools including Lincoln-Eliot Elementary School, Bigelow Middle School, and Newton North High School.
Ownership History
Date
Name
Owned For
Owner Type
Purchase Details
Closed on
Apr 27, 2012
Sold by
Schipani Jennie M Est and Fucci
Bought by
Fucci Ft and Fucci
Current Estimated Value
Home Financials for this Owner
Home Financials are based on the most recent Mortgage that was taken out on this home.
Original Mortgage
$250,000
Outstanding Balance
$172,060
Interest Rate
3.91%
Mortgage Type
New Conventional
Estimated Equity
$755,604
Create a Home Valuation Report for This Property
The Home Valuation Report is an in-depth analysis detailing your home's value as well as a comparison with similar homes in the area
Home Values in the Area
Average Home Value in this Area
Purchase History
| Date | Buyer | Sale Price | Title Company |
|---|---|---|---|
| Fucci Ft | -- | -- | |
| Fucci Ft | -- | -- | |
| Fucci Ft | -- | -- |
Source: Public Records
Mortgage History
| Date | Status | Borrower | Loan Amount |
|---|---|---|---|
| Open | Fucci Ft | $250,000 | |
| Closed | Fucci Ft | $250,000 | |
| Previous Owner | Fucci Ft | $45,000 |
Source: Public Records
Tax History Compared to Growth
Tax History
| Year | Tax Paid | Tax Assessment Tax Assessment Total Assessment is a certain percentage of the fair market value that is determined by local assessors to be the total taxable value of land and additions on the property. | Land | Improvement |
|---|---|---|---|---|
| 2025 | $8,908 | $909,000 | $686,700 | $222,300 |
| 2024 | $8,613 | $882,500 | $666,700 | $215,800 |
| 2023 | $8,042 | $790,000 | $496,200 | $293,800 |
| 2022 | $7,695 | $731,500 | $459,400 | $272,100 |
| 2021 | $7,425 | $690,100 | $433,400 | $256,700 |
| 2020 | $7,205 | $690,100 | $433,400 | $256,700 |
| 2019 | $7,002 | $670,000 | $420,800 | $249,200 |
| 2018 | $6,560 | $606,300 | $379,600 | $226,700 |
| 2017 | $6,361 | $572,000 | $358,100 | $213,900 |
| 2016 | $6,084 | $534,600 | $334,700 | $199,900 |
| 2015 | $5,800 | $499,600 | $312,800 | $186,800 |
Source: Public Records
Map
Nearby Homes
- 290 Watertown St Unit 3
- 290 Watertown St Unit 4
- 34 West St Unit A
- 53 West St
- 158 Adams St
- 180 Adams St Unit 2
- 86 West St
- 11 Murphy Ct
- 12-14 Middle St
- 3 Ashmont Ave
- 30 Middle St
- 68 Los Angeles St Unit PH5
- 20 Clinton St Unit 16
- 77 Pond Ave Unit 1103
- 22-24 Emerald St
- 90 Waban Park Unit 2
- 141 Morse St
- 282 Nevada St Unit 282
- 286 Nevada St Unit 286
- 42-44 Judkins St
- 13 Cook St
- 15 Cook St
- 13 Cook St Unit 1
- 13 Cook St Unit 13
- 17 Cook St Unit 3
- 17 Cook St Unit 17
- 17 Cook St
- 148 Chapel St Unit 150
- 148 Chapel St Unit 148
- 148 Chapel St Unit A
- 150 Chapel St Unit 150
- 154 Chapel St Unit 156
- 144 Chapel St
- 146 Chapel St
- 308 Watertown St
- 21 Cook St
- 21 Cook St Unit 21
- 12 Cook St
- 162 Chapel St
- 162 Chapel St Unit 162