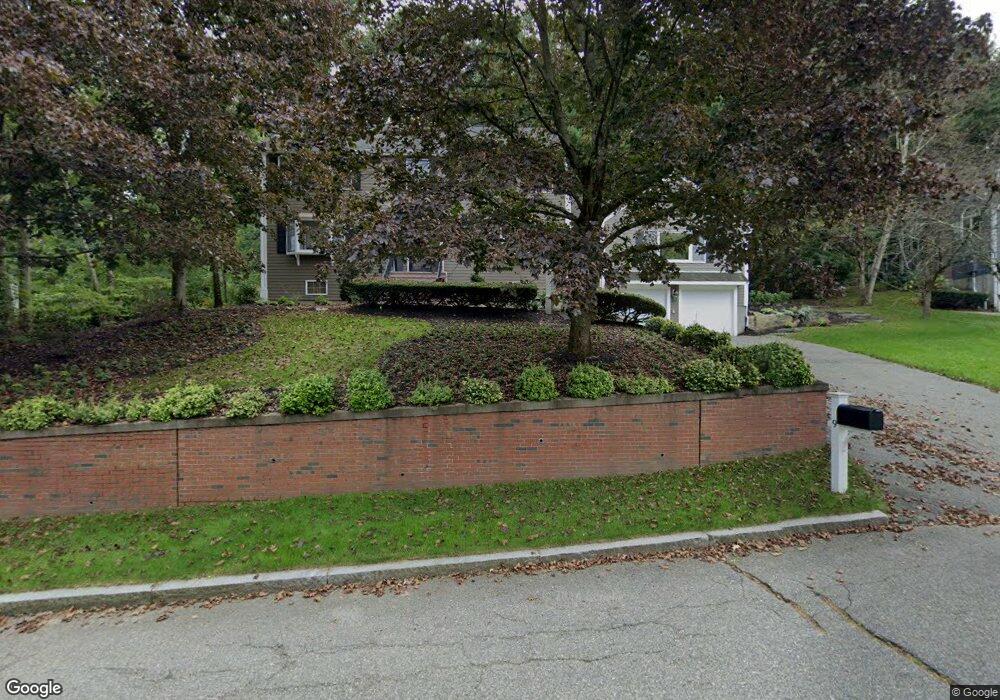
9 Coolidge Rd Winchester, MA 01890
West Side NeighborhoodEstimated Value: $1,839,111 - $1,988,000
4
Beds
3
Baths
3,879
Sq Ft
$493/Sq Ft
Est. Value
About This Home
This home is located at 9 Coolidge Rd, Winchester, MA 01890 and is currently estimated at $1,912,528, approximately $493 per square foot. 9 Coolidge Rd is a home located in Middlesex County with nearby schools including Vinson-Owen Elementary School, McCall Middle School, and Winchester High School.
Ownership History
Date
Name
Owned For
Owner Type
Purchase Details
Closed on
Dec 11, 1997
Sold by
Dipietro Robert P and Dipietro Sherrill A
Bought by
Dangelo Nicholas and Ingalls Dianne J
Current Estimated Value
Home Financials for this Owner
Home Financials are based on the most recent Mortgage that was taken out on this home.
Original Mortgage
$400,000
Outstanding Balance
$67,135
Interest Rate
7.14%
Mortgage Type
Purchase Money Mortgage
Estimated Equity
$1,845,393
Create a Home Valuation Report for This Property
The Home Valuation Report is an in-depth analysis detailing your home's value as well as a comparison with similar homes in the area
Home Values in the Area
Average Home Value in this Area
Purchase History
| Date | Buyer | Sale Price | Title Company |
|---|---|---|---|
| Dangelo Nicholas | $500,000 | -- |
Source: Public Records
Mortgage History
| Date | Status | Borrower | Loan Amount |
|---|---|---|---|
| Open | Dangelo Nicholas | $400,000 |
Source: Public Records
Tax History
| Year | Tax Paid | Tax Assessment Tax Assessment Total Assessment is a certain percentage of the fair market value that is determined by local assessors to be the total taxable value of land and additions on the property. | Land | Improvement |
|---|---|---|---|---|
| 2025 | $193 | $1,738,100 | $1,000,100 | $738,000 |
| 2024 | $18,135 | $1,600,600 | $920,100 | $680,500 |
| 2023 | $16,839 | $1,427,000 | $760,100 | $666,900 |
| 2022 | $16,766 | $1,340,200 | $700,100 | $640,100 |
| 2021 | $6,412 | $1,240,200 | $600,100 | $640,100 |
| 2020 | $15,366 | $1,240,200 | $600,100 | $640,100 |
| 2019 | $14,534 | $1,200,200 | $560,100 | $640,100 |
| 2018 | $5,802 | $1,135,800 | $515,100 | $620,700 |
| 2017 | $13,579 | $1,105,800 | $515,100 | $590,700 |
| 2016 | $12,684 | $1,086,000 | $515,100 | $570,900 |
| 2015 | $12,096 | $996,400 | $449,100 | $547,300 |
| 2014 | $12,254 | $967,900 | $430,100 | $537,800 |
Source: Public Records
Map
Nearby Homes
Your Personal Tour Guide
Ask me questions while you tour the home.