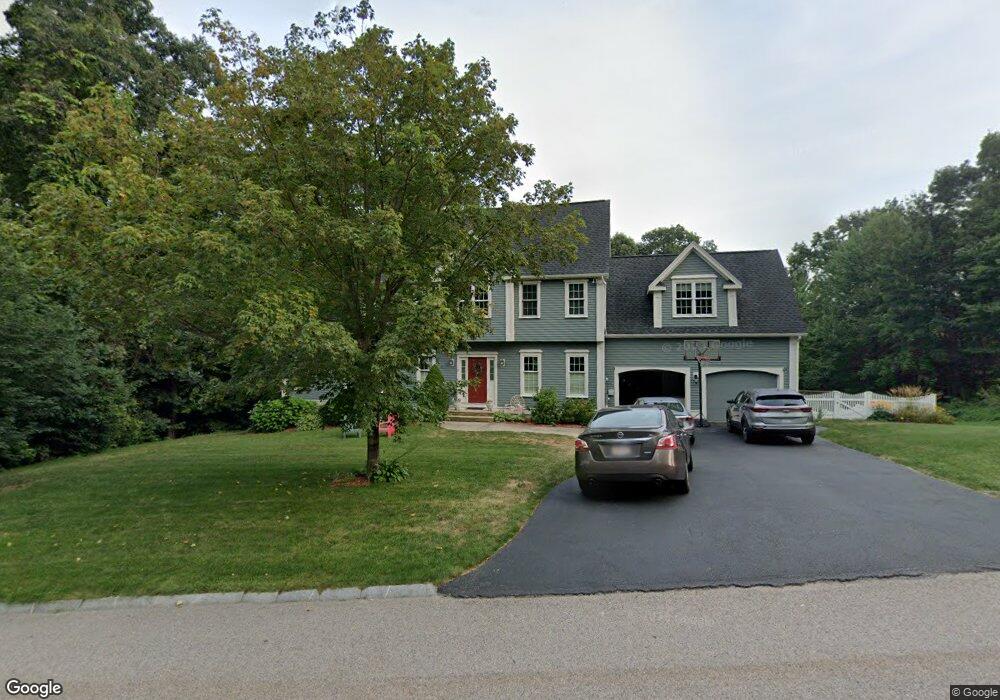
9 Cortland Way Grafton, MA 01519
Estimated Value: $942,000 - $1,116,000
4
Beds
3
Baths
2,600
Sq Ft
$381/Sq Ft
Est. Value
About This Home
This home is located at 9 Cortland Way, Grafton, MA 01519 and is currently estimated at $991,484, approximately $381 per square foot. 9 Cortland Way is a home located in Worcester County with nearby schools including Grafton High School, Silver Spruce Montessori School, and Assumption School.
Ownership History
Date
Name
Owned For
Owner Type
Purchase Details
Closed on
Nov 26, 2012
Sold by
Croucher Declan C
Bought by
Croucher Declan C and Leahy Anne M
Current Estimated Value
Purchase Details
Closed on
Aug 19, 2010
Sold by
Stumm Matthew K and Stumm Michelle R
Bought by
Croucher Declan G
Home Financials for this Owner
Home Financials are based on the most recent Mortgage that was taken out on this home.
Original Mortgage
$401,600
Interest Rate
4.63%
Mortgage Type
Purchase Money Mortgage
Purchase Details
Closed on
Jan 25, 2007
Sold by
Art Lot Acres Dev Corp
Bought by
Stumm Matthew K and Stumm Michelle R
Home Financials for this Owner
Home Financials are based on the most recent Mortgage that was taken out on this home.
Original Mortgage
$417,000
Interest Rate
6.15%
Mortgage Type
Purchase Money Mortgage
Create a Home Valuation Report for This Property
The Home Valuation Report is an in-depth analysis detailing your home's value as well as a comparison with similar homes in the area
Home Values in the Area
Average Home Value in this Area
Purchase History
| Date | Buyer | Sale Price | Title Company |
|---|---|---|---|
| Croucher Declan C | -- | -- | |
| Croucher Declan G | $502,000 | -- | |
| Stumm Matthew K | $599,000 | -- |
Source: Public Records
Mortgage History
| Date | Status | Borrower | Loan Amount |
|---|---|---|---|
| Previous Owner | Croucher Declan G | $401,600 | |
| Previous Owner | Stumm Matthew K | $417,000 |
Source: Public Records
Tax History Compared to Growth
Tax History
| Year | Tax Paid | Tax Assessment Tax Assessment Total Assessment is a certain percentage of the fair market value that is determined by local assessors to be the total taxable value of land and additions on the property. | Land | Improvement |
|---|---|---|---|---|
| 2025 | $12,809 | $918,900 | $224,200 | $694,700 |
| 2024 | $12,720 | $888,900 | $224,800 | $664,100 |
| 2023 | $11,775 | $749,500 | $224,800 | $524,700 |
| 2022 | $11,460 | $678,900 | $192,800 | $486,100 |
| 2021 | $11,277 | $656,400 | $175,200 | $481,200 |
| 2020 | $10,893 | $660,200 | $175,200 | $485,000 |
| 2019 | $10,136 | $608,400 | $153,900 | $454,500 |
| 2018 | $9,154 | $551,800 | $152,600 | $399,200 |
| 2017 | $8,876 | $541,200 | $142,000 | $399,200 |
| 2016 | $8,802 | $525,500 | $150,200 | $375,300 |
| 2015 | $8,724 | $528,700 | $150,200 | $378,500 |
| 2014 | $7,841 | $513,800 | $159,200 | $354,600 |
Source: Public Records
Map
Nearby Homes
- 75 Potter Hill Rd
- 81 Millbury St
- 8 Hudson Ave
- 7 Pleasant St
- 156 Brigham Hill Rd
- 20 Woodridge Rd
- 63 Providence Rd Unit 2
- 13 Pullard Rd Unit 38
- 29 Pullard Rd
- 51 Londonderry Rd Unit 51
- 70 Londonderry Rd
- 8 Autumn Gate Cir
- 30 Nottingham Rd
- Lot 1 Cooper Rd
- 151 Providence Rd Unit 24
- 9 Logan Path
- 17 Worcester St
- 115 Ariel Cir
- 5 Lincoln Ln Unit 5
- 150 Ariel Cir
- 2 Autumn Harvest Ct
- 11 Cortland Way
- 4 Autumn Harvest Ct
- 72 Crosby Rd
- 74 Crosby Rd
- 70 Crosby Rd
- 1 Cider Mill Ln
- 3 Autumn Harvest Ct
- 0 Cider Mill Ln Unit 70262395
- 110 Millbury St
- 68 Crosby Rd
- 49 Cider Mill Ln
- 6 Autumn Harvest Ct
- 14 Cortland Way
- 3 Cider Mill Ln Unit 50
- 3 Cider Mill Ln
- 7 Autumn Harvest Ct
- 3 Cider Mill Ln
- 114 Millbury St
- 50 Cider Mill Ln