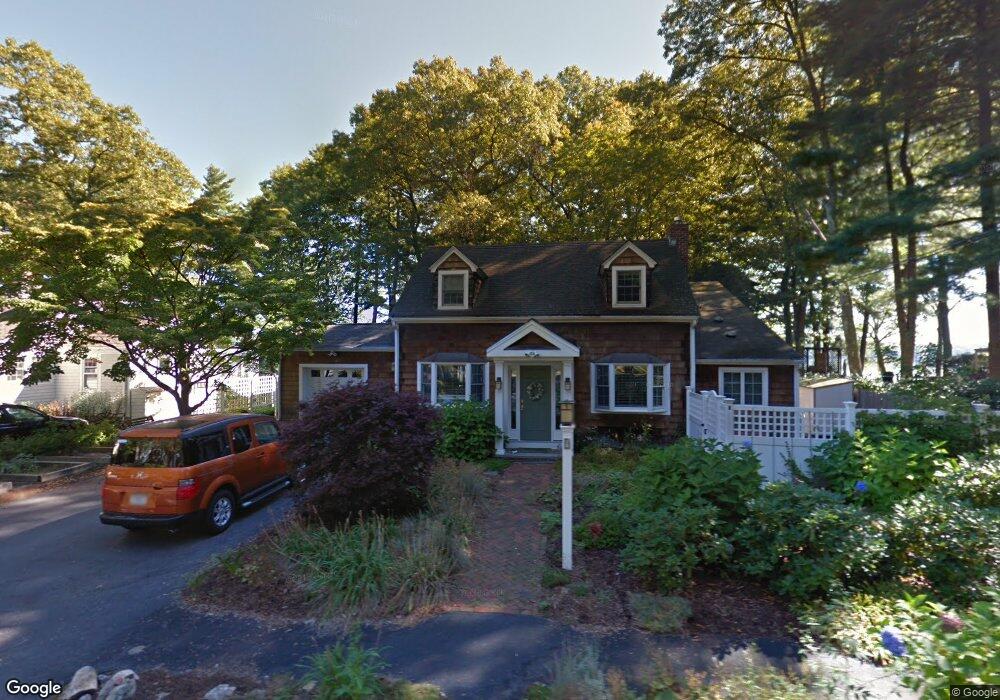
9 Crescent St Natick, MA 01760
Estimated Value: $1,301,922 - $1,544,000
4
Beds
3
Baths
2,740
Sq Ft
$499/Sq Ft
Est. Value
About This Home
This home is located at 9 Crescent St, Natick, MA 01760 and is currently estimated at $1,365,981, approximately $498 per square foot. 9 Crescent St is a home located in Middlesex County with nearby schools including Natick High School, J F Kennedy Middle School, and Johnson Elementary School.
Ownership History
Date
Name
Owned For
Owner Type
Purchase Details
Closed on
Jul 27, 1990
Sold by
Berkowitz David A
Bought by
Berkowitz Carole A
Current Estimated Value
Home Financials for this Owner
Home Financials are based on the most recent Mortgage that was taken out on this home.
Original Mortgage
$176,000
Interest Rate
10.01%
Mortgage Type
Purchase Money Mortgage
Create a Home Valuation Report for This Property
The Home Valuation Report is an in-depth analysis detailing your home's value as well as a comparison with similar homes in the area
Home Values in the Area
Average Home Value in this Area
Purchase History
| Date | Buyer | Sale Price | Title Company |
|---|---|---|---|
| Berkowitz Carole A | $39,000 | -- |
Source: Public Records
Mortgage History
| Date | Status | Borrower | Loan Amount |
|---|---|---|---|
| Closed | Berkowitz Carole A | $145,500 | |
| Closed | Berkowitz Carole A | $176,000 | |
| Previous Owner | Berkowitz Carole A | $76,000 |
Source: Public Records
Tax History
| Year | Tax Paid | Tax Assessment Tax Assessment Total Assessment is a certain percentage of the fair market value that is determined by local assessors to be the total taxable value of land and additions on the property. | Land | Improvement |
|---|---|---|---|---|
| 2025 | $14,425 | $1,206,100 | $653,500 | $552,600 |
| 2024 | $13,367 | $1,090,300 | $578,100 | $512,200 |
| 2023 | $12,774 | $1,010,600 | $532,500 | $478,100 |
| 2022 | $12,404 | $929,800 | $482,000 | $447,800 |
| 2021 | $11,590 | $851,600 | $431,800 | $419,800 |
| 2020 | $11,590 | $851,600 | $431,800 | $419,800 |
| 2019 | $14,586 | $851,600 | $431,800 | $419,800 |
| 2018 | $10,755 | $824,100 | $431,800 | $392,300 |
| 2017 | $10,734 | $795,700 | $410,500 | $385,200 |
| 2016 | $10,296 | $758,700 | $376,900 | $381,800 |
| 2015 | $9,714 | $702,900 | $353,400 | $349,500 |
Source: Public Records
Map
Nearby Homes
- 21 Kelsey Rd
- 15 Edwards Rd
- 27 2nd St
- 79 Speen St
- 54 Pilgrim Rd
- 26 Wellesley Ave Unit B
- 36 Silver Hill Ln Unit 21
- 89 W Central St
- 293 Bacon St Unit A
- 46 Silver Hill Ln Unit 1
- 7 Jackson Ct Unit B
- 3 Silver Hill Ln Unit 6
- 3 Oxbow Rd
- 9 Bellevue Rd
- 8 Village Way Unit 11
- 1 Post Oak Ln Unit 19
- 15 Village Way Unit 8
- 7 High St
- 40 Nouvelle Way Unit 441
- 5 Reynolds Ave Unit 2
Your Personal Tour Guide
Ask me questions while you tour the home.