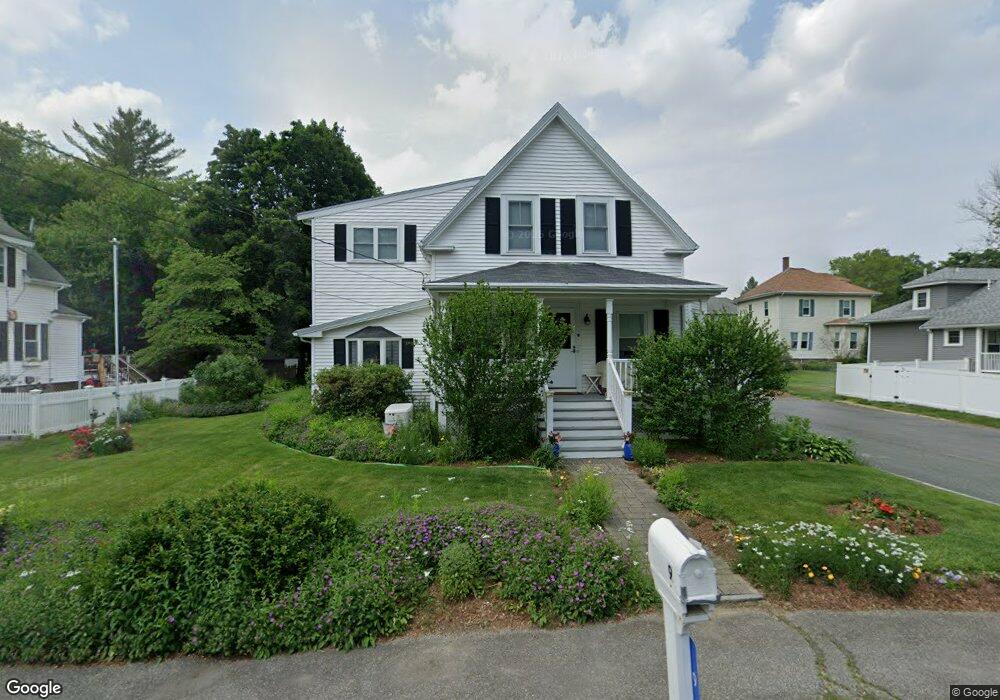
9 Crescent St West Bridgewater, MA 02379
Estimated Value: $525,000 - $602,000
3
Beds
2
Baths
1,949
Sq Ft
$289/Sq Ft
Est. Value
About This Home
This home is located at 9 Crescent St, West Bridgewater, MA 02379 and is currently estimated at $563,553, approximately $289 per square foot. 9 Crescent St is a home located in Plymouth County with nearby schools including Spring Street Elementary School, Rose L. MacDonald Elementary School, and Howard Elementary School.
Ownership History
Date
Name
Owned For
Owner Type
Purchase Details
Closed on
Jan 31, 2007
Sold by
Mahoney Francis X and Mahoney Mary P
Bought by
Mahoney Tr Francis X and Mahoney Mary P
Current Estimated Value
Purchase Details
Closed on
Mar 26, 2003
Sold by
Mahoney Francis X and Mahoney Mary P
Bought by
Mahoney Francis X and Mahoney Mary P
Create a Home Valuation Report for This Property
The Home Valuation Report is an in-depth analysis detailing your home's value as well as a comparison with similar homes in the area
Home Values in the Area
Average Home Value in this Area
Purchase History
| Date | Buyer | Sale Price | Title Company |
|---|---|---|---|
| Mahoney Tr Francis X | -- | -- | |
| Mahoney Francis X | -- | -- |
Source: Public Records
Mortgage History
| Date | Status | Borrower | Loan Amount |
|---|---|---|---|
| Previous Owner | Mahoney Francis X | $40,000 | |
| Previous Owner | Mahoney Francis X | $20,000 | |
| Previous Owner | Mahoney Francis X | $20,000 |
Source: Public Records
Tax History Compared to Growth
Tax History
| Year | Tax Paid | Tax Assessment Tax Assessment Total Assessment is a certain percentage of the fair market value that is determined by local assessors to be the total taxable value of land and additions on the property. | Land | Improvement |
|---|---|---|---|---|
| 2025 | $6,147 | $449,700 | $195,800 | $253,900 |
| 2024 | $5,909 | $417,000 | $177,500 | $239,500 |
| 2023 | $5,581 | $363,100 | $153,700 | $209,400 |
| 2022 | $5,259 | $324,200 | $144,500 | $179,700 |
| 2021 | $5,369 | $321,300 | $144,500 | $176,800 |
| 2020 | $5,260 | $321,300 | $144,500 | $176,800 |
| 2019 | $5,123 | $309,900 | $144,500 | $165,400 |
| 2018 | $4,882 | $289,200 | $137,200 | $152,000 |
| 2017 | $4,757 | $268,300 | $124,400 | $143,900 |
| 2016 | $4,671 | $259,500 | $115,600 | $143,900 |
| 2015 | $4,672 | $262,300 | $115,600 | $146,700 |
| 2014 | $4,325 | $262,300 | $115,600 | $146,700 |
Source: Public Records
Map
Nearby Homes