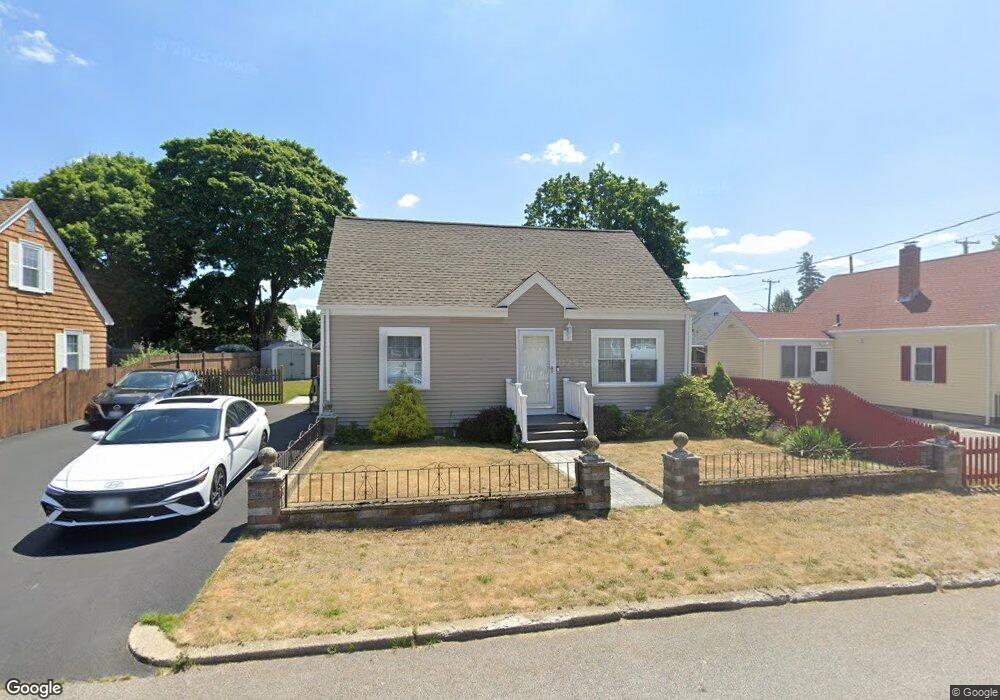
9 Cumberland St Pawtucket, RI 02861
Darlington NeighborhoodEstimated Value: $368,000 - $396,000
3
Beds
1
Bath
1,314
Sq Ft
$290/Sq Ft
Est. Value
About This Home
This home is located at 9 Cumberland St, Pawtucket, RI 02861 and is currently estimated at $381,125, approximately $290 per square foot. 9 Cumberland St is a home located in Providence County with nearby schools including St Cecilia School and Dayspring Christian Academy.
Ownership History
Date
Name
Owned For
Owner Type
Purchase Details
Closed on
Jan 22, 2004
Sold by
Gomes Joao A
Bought by
Silva Darrell M
Current Estimated Value
Purchase Details
Closed on
Jan 7, 2003
Sold by
Vieira Anthony and Vieira Judith
Bought by
Mastrobuono Stefanie
Home Financials for this Owner
Home Financials are based on the most recent Mortgage that was taken out on this home.
Original Mortgage
$90,000
Interest Rate
5.88%
Purchase Details
Closed on
Nov 17, 1999
Sold by
Williams Eleanor R
Bought by
Gomes Joao A and Gomes Maria S
Home Financials for this Owner
Home Financials are based on the most recent Mortgage that was taken out on this home.
Original Mortgage
$60,000
Interest Rate
7.76%
Purchase Details
Closed on
Jan 7, 1997
Sold by
Rounds Carolyn A and Farrar Madelyn A
Bought by
Robert Eleanor E
Home Financials for this Owner
Home Financials are based on the most recent Mortgage that was taken out on this home.
Original Mortgage
$68,359
Interest Rate
7.48%
Create a Home Valuation Report for This Property
The Home Valuation Report is an in-depth analysis detailing your home's value as well as a comparison with similar homes in the area
Home Values in the Area
Average Home Value in this Area
Purchase History
| Date | Buyer | Sale Price | Title Company |
|---|---|---|---|
| Silva Darrell M | $183,000 | -- | |
| Mastrobuono Stefanie | $137,000 | -- | |
| Gomes Joao A | $75,000 | -- | |
| Robert Eleanor E | $69,000 | -- |
Source: Public Records
Mortgage History
| Date | Status | Borrower | Loan Amount |
|---|---|---|---|
| Previous Owner | Robert Eleanor E | $90,000 | |
| Previous Owner | Robert Eleanor E | $134,784 | |
| Previous Owner | Robert Eleanor E | $60,000 | |
| Previous Owner | Robert Eleanor E | $68,359 |
Source: Public Records
Tax History Compared to Growth
Tax History
| Year | Tax Paid | Tax Assessment Tax Assessment Total Assessment is a certain percentage of the fair market value that is determined by local assessors to be the total taxable value of land and additions on the property. | Land | Improvement |
|---|---|---|---|---|
| 2025 | $3,737 | $284,200 | $123,800 | $160,400 |
| 2024 | $3,507 | $284,200 | $123,800 | $160,400 |
| 2023 | $3,608 | $213,000 | $77,400 | $135,600 |
| 2022 | $3,532 | $213,000 | $77,400 | $135,600 |
| 2021 | $3,532 | $213,000 | $77,400 | $135,600 |
| 2020 | $3,353 | $160,500 | $61,100 | $99,400 |
| 2019 | $3,353 | $160,500 | $61,100 | $99,400 |
| 2018 | $3,231 | $160,500 | $61,100 | $99,400 |
| 2017 | $3,197 | $140,700 | $50,300 | $90,400 |
| 2016 | $3,080 | $140,700 | $50,300 | $90,400 |
| 2015 | $3,080 | $140,700 | $50,300 | $90,400 |
| 2014 | $2,991 | $129,700 | $50,300 | $79,400 |
Source: Public Records
Map
Nearby Homes
- 50 Stearns St
- 207 Benefit St
- 139 Tweed St
- 68 Slade St
- 44 Stanley St
- 0 Chaplin St
- 83 Chaplin St
- 39 Chaplin St
- 118 Chaplin St
- 97 Wendell St
- 19 Lodi St
- 179 Columbine Ave
- 180 Darlingdale Ave
- 31 Norris Ave
- 27 Aiken St
- 548 Kenyon Ave Unit 25
- 548 Kenyon Ave Unit 27
- 548 Kenyon Ave Unit 45
- 41 Calder St
- 65 Cedarbrook Rd