
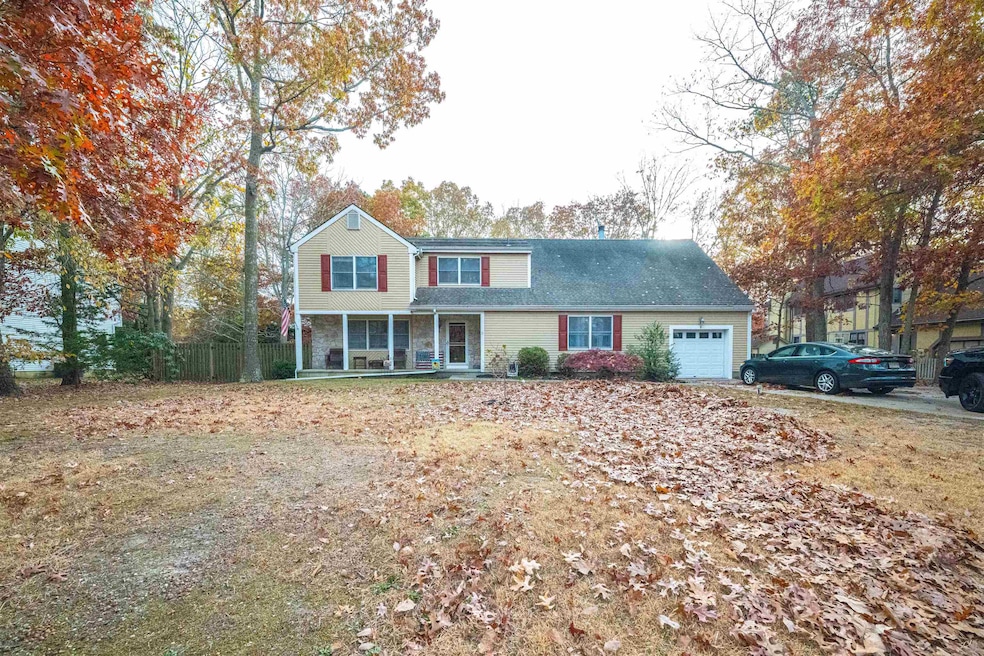


9 Cynwyd Dr Cape May Court House, NJ 08210
5
Beds
4
Baths
3,297
Sq Ft
2.53
Acres
Highlights
- Deck
- Main Floor Primary Bedroom
- Great Room
- Middle Township Elementary No. 1 Rated A-
- Sun or Florida Room
- Den
About This Home
As of January 2025This home is located at 9 Cynwyd Dr, Cape May Court House, NJ 08210 and is currently priced at $605,000, approximately $183 per square foot. This property was built in 1981. 9 Cynwyd Dr is a home located in Cape May County with nearby schools including Middle Township Elementary No. 1, Middle Township Elementary No. 2, and Middle Township Middle School.
Last Agent to Sell the Property
Coldwell Banker Sol Needles Real Estate Listed on: 11/20/2024
Home Details
Home Type
- Single Family
Est. Annual Taxes
- $7,958
Year Built
- Built in 1981
Lot Details
- Lot Dimensions are 110 x 140
- Fenced Yard
- Interior Lot
Home Design
- Vinyl Siding
- Stone Exterior Construction
Interior Spaces
- 3,297 Sq Ft Home
- 2-Story Property
- Skylights
- Gas Fireplace
- Drapes & Rods
- Blinds
- Great Room
- Living Room
- Dining Room
- Den
- Sun or Florida Room
- Storage
- Crawl Space
- Storage In Attic
- Fire and Smoke Detector
Kitchen
- Eat-In Kitchen
- Self-Cleaning Oven
- Range
- Microwave
- Dishwasher
Flooring
- Wall to Wall Carpet
- Laminate
- Tile
Bedrooms and Bathrooms
- 5 Bedrooms
- Primary Bedroom on Main
- Walk-In Closet
- 4 Full Bathrooms
Laundry
- Laundry Room
- Dryer
- Washer
Parking
- 4 Car Attached Garage
- Automatic Garage Door Opener
- Driveway
Eco-Friendly Details
- Solar owned by a third party
Outdoor Features
- Deck
- Patio
- Porch
Utilities
- Forced Air Zoned Heating and Cooling System
- Heating System Uses Natural Gas
- Well
- Natural Gas Water Heater
- Cable TV Available
Listing and Financial Details
- Legal Lot and Block 10 / 212
Ownership History
Date
Name
Owned For
Owner Type
Purchase Details
Listed on
Nov 20, 2024
Closed on
Jan 27, 2025
Sold by
Walters Erik D
Bought by
Wetherill Liberty
Seller's Agent
James McBride
Coldwell Banker Sol Needles Real Estate
Buyer's Agent
Gail Wilsey-Morrison, CRS, ABR
LONG & FOSTER REAL ESTATE, INC cm
List Price
$625,000
Sold Price
$605,000
Premium/Discount to List
-$20,000
-3.2%
Views
12
Current Estimated Value
Home Financials for this Owner
Home Financials are based on the most recent Mortgage that was taken out on this home.
Estimated Appreciation
$78,521
Avg. Annual Appreciation
23.42%
Purchase Details
Closed on
Jun 24, 2022
Sold by
Walters Carole M and Walters Erik D
Bought by
Walters Erik D and Kmec Tonya M
Home Financials for this Owner
Home Financials are based on the most recent Mortgage that was taken out on this home.
Original Mortgage
$219,000
Interest Rate
5.1%
Mortgage Type
New Conventional
Purchase Details
Listed on
Feb 17, 2018
Closed on
Apr 13, 2018
Sold by
Marks Kathleen
Bought by
Walters Carole M and Walters Erik D
Seller's Agent
Hugh Merkle
COMPASS RE - Stone Harbor
Buyer's Agent
James McBride
Coldwell Banker Sol Needles Real Estate
List Price
$379,900
Sold Price
$360,000
Premium/Discount to List
-$19,900
-5.24%
Home Financials for this Owner
Home Financials are based on the most recent Mortgage that was taken out on this home.
Avg. Annual Appreciation
9.05%
Purchase Details
Listed on
Apr 18, 2013
Closed on
Oct 3, 2013
Sold by
Stevenson Joseph F and Stevenson Gail M
Bought by
Marks John A and Marks Kathleen
Seller's Agent
Stacey Burns
TIM KERR SOTHEBY'S INTL REALTY
Buyer's Agent
Tom McMullen
LONG and FOSTER REAL ESTATE INC-Stone Harbor
List Price
$345,500
Sold Price
$345,500
Home Financials for this Owner
Home Financials are based on the most recent Mortgage that was taken out on this home.
Avg. Annual Appreciation
0.91%
Purchase Details
Closed on
Jun 27, 1989
Sold by
Shute Thomas and Shute Carol
Bought by
Farooqui Zaheer and Farooqui Afifa
Similar Homes in the area
Create a Home Valuation Report for This Property
The Home Valuation Report is an in-depth analysis detailing your home's value as well as a comparison with similar homes in the area
Home Values in the Area
Average Home Value in this Area
Purchase History
| Date | Type | Sale Price | Title Company |
|---|---|---|---|
| Deed | $605,000 | None Listed On Document | |
| Deed | $605,000 | None Listed On Document | |
| Quit Claim Deed | -- | Amrock | |
| Deed | $360,000 | -- | |
| Deed | $345,500 | None Available | |
| Deed | $52,000 | -- |
Source: Public Records
Mortgage History
| Date | Status | Loan Amount | Loan Type |
|---|---|---|---|
| Previous Owner | $219,000 | New Conventional | |
| Previous Owner | $184,729 | Stand Alone Refi Refinance Of Original Loan | |
| Previous Owner | $125,000 | Stand Alone Refi Refinance Of Original Loan | |
| Previous Owner | $100,000 | Unknown | |
| Previous Owner | $300,077 | Unknown | |
| Previous Owner | $50,000 | Credit Line Revolving | |
| Previous Owner | $70,067 | Unknown |
Source: Public Records
Property History
| Date | Event | Price | Change | Sq Ft Price |
|---|---|---|---|---|
| 01/27/2025 01/27/25 | Sold | $605,000 | -3.2% | $184 / Sq Ft |
| 12/02/2024 12/02/24 | Pending | -- | -- | -- |
| 11/20/2024 11/20/24 | For Sale | $625,000 | +73.6% | $190 / Sq Ft |
| 04/04/2018 04/04/18 | Sold | $360,000 | -5.2% | $109 / Sq Ft |
| 03/05/2018 03/05/18 | Pending | -- | -- | -- |
| 02/17/2018 02/17/18 | For Sale | $379,900 | +10.0% | $115 / Sq Ft |
| 09/27/2013 09/27/13 | Sold | $345,500 | 0.0% | -- |
| 08/18/2013 08/18/13 | Pending | -- | -- | -- |
| 04/18/2013 04/18/13 | For Sale | $345,500 | -- | -- |
Source: Cape May County Association of REALTORS®
Tax History Compared to Growth
Tax History
| Year | Tax Paid | Tax Assessment Tax Assessment Total Assessment is a certain percentage of the fair market value that is determined by local assessors to be the total taxable value of land and additions on the property. | Land | Improvement |
|---|---|---|---|---|
| 2025 | $8,164 | $387,100 | $150,800 | $236,300 |
| 2024 | $8,164 | $387,100 | $150,800 | $236,300 |
| 2023 | $7,959 | $387,100 | $150,800 | $236,300 |
| 2022 | $7,730 | $387,100 | $150,800 | $236,300 |
| 2021 | $7,545 | $387,100 | $150,800 | $236,300 |
| 2020 | $7,390 | $387,100 | $150,800 | $236,300 |
| 2019 | $7,200 | $387,100 | $150,800 | $236,300 |
| 2018 | $7,088 | $387,100 | $150,800 | $236,300 |
| 2017 | $6,945 | $387,100 | $150,800 | $236,300 |
| 2016 | $6,770 | $387,100 | $150,800 | $236,300 |
| 2015 | $6,720 | $387,100 | $150,800 | $236,300 |
| 2014 | $6,677 | $387,100 | $150,800 | $236,300 |
Source: Public Records
Agents Affiliated with this Home
-
James McBride
J
Seller's Agent in 2025
James McBride
Coldwell Banker Sol Needles Real Estate
(609) 408-3076
3 in this area
42 Total Sales
-
Gail Wilsey-Morrison, CRS, ABR
Buyer's Agent in 2025
Gail Wilsey-Morrison, CRS, ABR
LONG & FOSTER REAL ESTATE, INC cm
(609) 884-1007
9 in this area
103 Total Sales
-
Hugh Merkle
Seller's Agent in 2018
Hugh Merkle
COMPASS RE - Stone Harbor
(609) 602-0300
13 in this area
98 Total Sales
-
Martha Jeannette DiNardo
M
Seller Co-Listing Agent in 2018
Martha Jeannette DiNardo
COMPASS RE - Stone Harbor
(609) 368-9100
5 in this area
24 Total Sales
-
Stacey Burns
S
Seller's Agent in 2013
Stacey Burns
TIM KERR SOTHEBY'S INTL REALTY
7 Total Sales
-
Tom McMullen
Buyer's Agent in 2013
Tom McMullen
LONG and FOSTER REAL ESTATE INC-Stone Harbor
(609) 602-9327
2 Total Sales
Map
Source: Cape May County Association of REALTORS®
MLS Number: 243429
APN: 06-00212-12-00010
Disclaimer: Certain information contained herein is derived from information provided by parties other than Homes.com. All information provided is deemed reliable, but is not guaranteed to be accurate and should be independently verified.
![]() Broker Reciprocity: The data relating to real estate for sale or rent on this web site comes in part from the Broker Reciprocity program of the Cape May County Multiple Listing Service. Real estate listings held by brokerage firms other than Ten-X are marked with the Broker Reciprocity logo or the Broker Reciprocity thumbnail logo and detailed information about them includes the name of the listing brokers. This information is deemed reliable but not guaranteed. Representations as subject to verification by inspection and subject to change without notice. Some properties which appear for sale or rent on this website may no longer be available because they are under contract, have sold, or are no longer being offered for sale or rent. Information is deemed to be accurate but not guaranteed.
Broker Reciprocity: The data relating to real estate for sale or rent on this web site comes in part from the Broker Reciprocity program of the Cape May County Multiple Listing Service. Real estate listings held by brokerage firms other than Ten-X are marked with the Broker Reciprocity logo or the Broker Reciprocity thumbnail logo and detailed information about them includes the name of the listing brokers. This information is deemed reliable but not guaranteed. Representations as subject to verification by inspection and subject to change without notice. Some properties which appear for sale or rent on this website may no longer be available because they are under contract, have sold, or are no longer being offered for sale or rent. Information is deemed to be accurate but not guaranteed.
Nearby Homes
- 13 Shadow Ln
- 10 Timberlea Ln
- 11 Winding Way
- 27 Sand Castle Dr
- 416 Goshen Rd
- 6 Wayne Ave
- 430 Route 9 N
- 9 Goshen Rd
- 4 Railroad Ave
- 108 Mechanic St
- 5 Acorn Ln
- 23 Acorn Ln
- 416 Hand Ave
- 506 Hand Ave
- 530 Stone Harbor Blvd
- 390 Court House South Dennis Rd
- 4 Darott Dr
- 57 Wynndemere Ct
- 100 Osprey Dr Unit 1A
- 202 Osprey Dr Unit B1