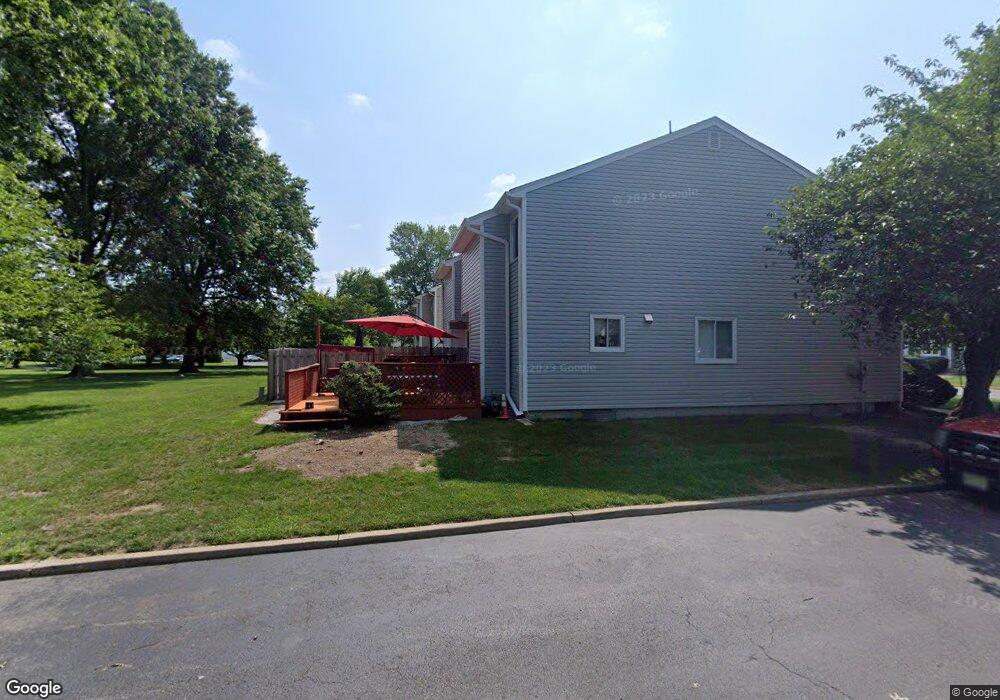
9 Davids Ct Dayton, NJ 08810
Estimated Value: $465,144 - $549,000
Studio
--
Bath
1,557
Sq Ft
$327/Sq Ft
Est. Value
About This Home
This home is located at 9 Davids Ct, Dayton, NJ 08810 and is currently estimated at $508,786, approximately $326 per square foot. 9 Davids Ct is a home located in Middlesex County with nearby schools including Indian Fields Elementary School, Crossroads South Middle School, and South Brunswick High School.
Ownership History
Date
Name
Owned For
Owner Type
Purchase Details
Closed on
Jan 6, 2006
Current Estimated Value
Home Financials for this Owner
Home Financials are based on the most recent Mortgage that was taken out on this home.
Original Mortgage
$240,000
Outstanding Balance
$127,593
Interest Rate
5.75%
Mortgage Type
Adjustable Rate Mortgage/ARM
Estimated Equity
$381,193
Purchase Details
Closed on
Aug 14, 2001
Sold by
Ravichandran T
Bought by
Saintfort Vladimir and Morgan Rosa
Home Financials for this Owner
Home Financials are based on the most recent Mortgage that was taken out on this home.
Original Mortgage
$158,000
Interest Rate
7.05%
Purchase Details
Closed on
Sep 27, 1994
Sold by
Friedman Alan
Bought by
Ravichandran Sayani and Ravichandran T
Home Financials for this Owner
Home Financials are based on the most recent Mortgage that was taken out on this home.
Original Mortgage
$113,000
Interest Rate
8.5%
Create a Home Valuation Report for This Property
The Home Valuation Report is an in-depth analysis detailing your home's value as well as a comparison with similar homes in the area
Home Values in the Area
Average Home Value in this Area
Purchase History
| Date | Buyer | Sale Price | Title Company |
|---|---|---|---|
| -- | -- | -- | |
| Saintfort Vladimir | $168,000 | -- | |
| Ravichandran Sayani | $118,500 | -- |
Source: Public Records
Mortgage History
| Date | Status | Borrower | Loan Amount |
|---|---|---|---|
| Open | -- | $240,000 | |
| Previous Owner | Saintfort Vladimir | $158,000 | |
| Previous Owner | Ravichandran Sayani | $113,000 |
Source: Public Records
Tax History
| Year | Tax Paid | Tax Assessment Tax Assessment Total Assessment is a certain percentage of the fair market value that is determined by local assessors to be the total taxable value of land and additions on the property. | Land | Improvement |
|---|---|---|---|---|
| 2025 | $6,461 | $119,600 | $40,000 | $79,600 |
| 2024 | $6,229 | $119,600 | $40,000 | $79,600 |
| 2023 | $6,229 | $119,600 | $40,000 | $79,600 |
| 2022 | $6,048 | $119,700 | $40,000 | $79,700 |
| 2021 | $4,655 | $119,700 | $40,000 | $79,700 |
| 2020 | $6,086 | $119,700 | $40,000 | $79,700 |
| 2019 | $6,141 | $119,700 | $40,000 | $79,700 |
| 2018 | $5,940 | $119,700 | $40,000 | $79,700 |
| 2017 | $5,931 | $119,700 | $40,000 | $79,700 |
| 2016 | $5,869 | $119,700 | $40,000 | $79,700 |
| 2015 | $5,689 | $119,700 | $40,000 | $79,700 |
| 2014 | $5,597 | $119,700 | $40,000 | $79,700 |
Source: Public Records
Map
Nearby Homes
Your Personal Tour Guide
Ask me questions while you tour the home.