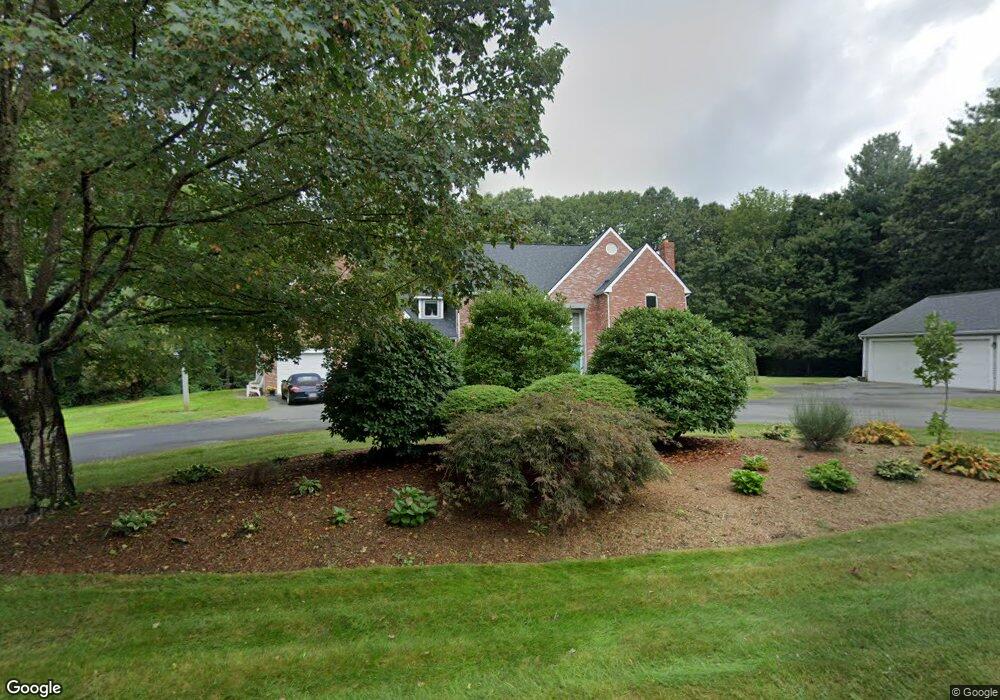
9 Davis Rd Southborough, MA 01772
Estimated Value: $1,428,000 - $2,269,000
5
Beds
6
Baths
4,181
Sq Ft
$421/Sq Ft
Est. Value
About This Home
This home is located at 9 Davis Rd, Southborough, MA 01772 and is currently estimated at $1,760,574, approximately $421 per square foot. 9 Davis Rd is a home located in Worcester County with nearby schools including Albert S. Woodward Memorial School, Margaret A. Neary School, and P. Brent Trottier Middle School.
Ownership History
Date
Name
Owned For
Owner Type
Purchase Details
Closed on
Oct 15, 1999
Sold by
Tharp Lisa A
Bought by
Ayub Zahra S and Ayub Saad
Current Estimated Value
Purchase Details
Closed on
Mar 14, 1997
Sold by
Finch Cindy Lu
Bought by
Tharp Kirk T and Tharp Lisa A
Create a Home Valuation Report for This Property
The Home Valuation Report is an in-depth analysis detailing your home's value as well as a comparison with similar homes in the area
Home Values in the Area
Average Home Value in this Area
Purchase History
| Date | Buyer | Sale Price | Title Company |
|---|---|---|---|
| Ayub Zahra S | $675,000 | -- | |
| Tharp Kirk T | $498,500 | -- |
Source: Public Records
Mortgage History
| Date | Status | Borrower | Loan Amount |
|---|---|---|---|
| Open | Tharp Kirk T | $417,000 | |
| Closed | Tharp Kirk T | $593,000 |
Source: Public Records
Tax History Compared to Growth
Tax History
| Year | Tax Paid | Tax Assessment Tax Assessment Total Assessment is a certain percentage of the fair market value that is determined by local assessors to be the total taxable value of land and additions on the property. | Land | Improvement |
|---|---|---|---|---|
| 2025 | $20,299 | $1,469,900 | $396,900 | $1,073,000 |
| 2024 | $18,720 | $1,345,800 | $381,700 | $964,100 |
| 2023 | $17,222 | $1,166,800 | $363,400 | $803,400 |
| 2022 | $16,327 | $1,002,900 | $316,700 | $686,200 |
| 2021 | $15,959 | $984,500 | $306,300 | $678,200 |
| 2020 | $15,982 | $959,300 | $300,600 | $658,700 |
| 2019 | $15,685 | $937,000 | $299,100 | $637,900 |
| 2018 | $14,862 | $920,800 | $300,200 | $620,600 |
| 2017 | $14,757 | $900,900 | $300,200 | $600,700 |
| 2016 | $14,996 | $947,900 | $305,400 | $642,500 |
| 2015 | $14,746 | $920,500 | $290,200 | $630,300 |
Source: Public Records
Map
Nearby Homes