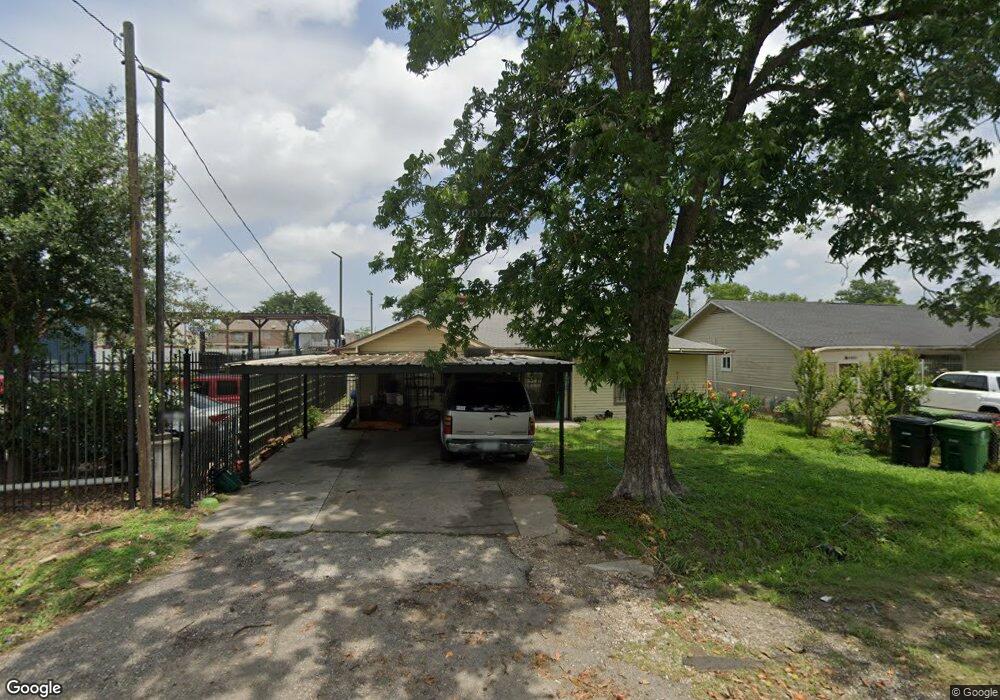
9 De Boll St Houston, TX 77022
Northside-Northline NeighborhoodEstimated Value: $212,692 - $240,000
4
Beds
2
Baths
2,131
Sq Ft
$107/Sq Ft
Est. Value
About This Home
This home is located at 9 De Boll St, Houston, TX 77022 and is currently estimated at $227,173, approximately $106 per square foot. 9 De Boll St is a home located in Harris County with nearby schools including Burbank Elementary School, Burbank Middle School, and Sam Houston Math, Science & Technology Center.
Ownership History
Date
Name
Owned For
Owner Type
Purchase Details
Closed on
Apr 12, 2000
Sold by
Deleon Francisco Javier and Cantu Rosaura Deleon
Bought by
Gallegos Manrique and Diaz Marvin Edmundo
Current Estimated Value
Purchase Details
Closed on
Mar 1, 2000
Sold by
Villareal Jose Alfredo and Devillareal Maricella Llano
Bought by
Deleon Francisco and Deleon Rosaura
Purchase Details
Closed on
Sep 3, 1994
Sold by
Cervantes George
Bought by
Villareal Jose Alfredo and Devillareal Maricella Llano
Home Financials for this Owner
Home Financials are based on the most recent Mortgage that was taken out on this home.
Original Mortgage
$25,000
Interest Rate
8.52%
Mortgage Type
Seller Take Back
Purchase Details
Closed on
Mar 17, 1994
Sold by
Hoebel Wallace Allen
Bought by
Cervantes George
Purchase Details
Closed on
Oct 28, 1993
Sold by
Cervantes George
Bought by
Hoebel Wallace Allen
Create a Home Valuation Report for This Property
The Home Valuation Report is an in-depth analysis detailing your home's value as well as a comparison with similar homes in the area
Home Values in the Area
Average Home Value in this Area
Purchase History
| Date | Buyer | Sale Price | Title Company |
|---|---|---|---|
| Gallegos Manrique | -- | -- | |
| Deleon Francisco | -- | -- | |
| Villareal Jose Alfredo | -- | -- | |
| Cervantes George | -- | -- | |
| Hoebel Wallace Allen | -- | -- |
Source: Public Records
Mortgage History
| Date | Status | Borrower | Loan Amount |
|---|---|---|---|
| Previous Owner | Villareal Jose Alfredo | $25,000 |
Source: Public Records
Tax History Compared to Growth
Tax History
| Year | Tax Paid | Tax Assessment Tax Assessment Total Assessment is a certain percentage of the fair market value that is determined by local assessors to be the total taxable value of land and additions on the property. | Land | Improvement |
|---|---|---|---|---|
| 2025 | $2,028 | $241,671 | $60,900 | $180,771 |
| 2024 | $2,028 | $244,190 | $60,900 | $183,290 |
| 2023 | $2,028 | $217,071 | $60,900 | $156,171 |
| 2022 | $3,144 | $175,820 | $46,400 | $129,420 |
| 2021 | $3,025 | $164,329 | $46,400 | $117,929 |
| 2020 | $2,857 | $136,148 | $46,400 | $89,748 |
| 2019 | $2,714 | $120,199 | $30,451 | $89,748 |
| 2018 | $1,682 | $97,520 | $30,451 | $67,069 |
| 2017 | $2,466 | $97,520 | $30,451 | $67,069 |
| 2016 | $2,420 | $95,723 | $30,451 | $65,272 |
| 2015 | -- | $93,824 | $30,451 | $63,373 |
| 2014 | -- | $0 | $0 | $0 |
Source: Public Records
Map
Nearby Homes
- Cypress Plan at Wellford Village
- Willow Plan at Wellford Village
- 44 Farrell St
- 70 Burress St
- 0 Burbank St Unit 9886770
- 45 Wellford St
- 61 Trenwood Ln
- 90 Burress St Unit B
- 90 Burress St Unit A
- 9625 Fulton St
- 91 Burbank St
- 56 Wellford St
- 40 Dipping Ln
- 46 Dipping Ln
- 104 Luetta St
- 106 Luetta St
- 58 Dipping Ln
- 9813 Fulton Park Ln
- 5035 North Fwy
- 108 Luetta St