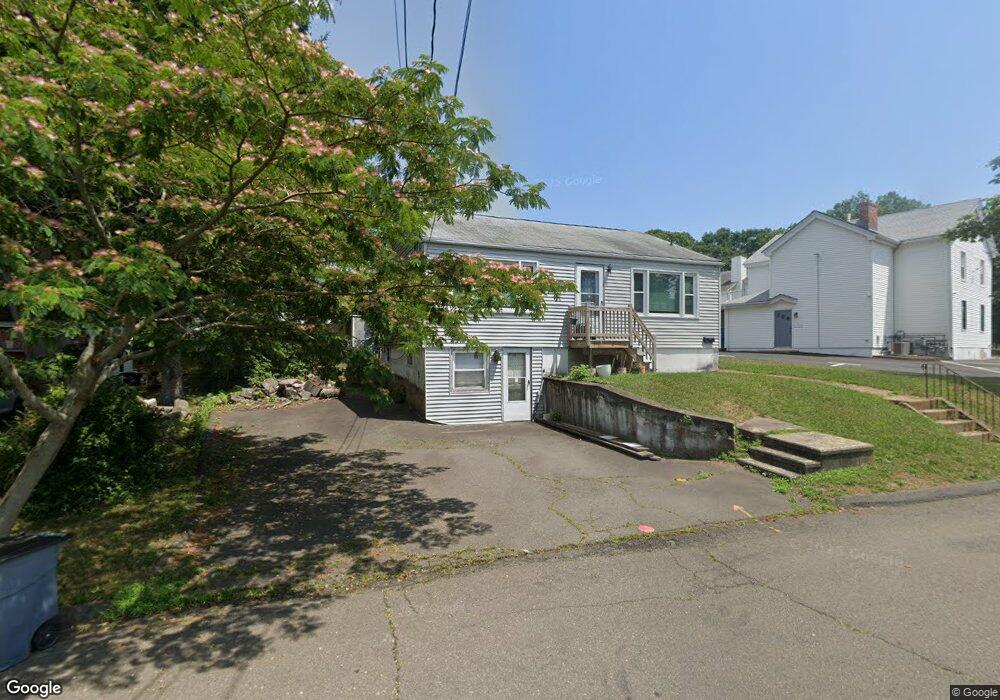
9 Deborah Ln East Haven, CT 06512
Estimated Value: $309,000 - $414,000
3
Beds
2
Baths
960
Sq Ft
$359/Sq Ft
Est. Value
About This Home
This home is located at 9 Deborah Ln, East Haven, CT 06512 and is currently estimated at $344,671, approximately $359 per square foot. 9 Deborah Ln is a home located in New Haven County with nearby schools including East Haven High School and Pathway School.
Ownership History
Date
Name
Owned For
Owner Type
Purchase Details
Closed on
Jul 30, 2007
Sold by
Moac-Mannix Cindi E
Bought by
Zullo 3Rd Alfred J and Zullo Roseann M
Current Estimated Value
Home Financials for this Owner
Home Financials are based on the most recent Mortgage that was taken out on this home.
Original Mortgage
$162,000
Interest Rate
6.78%
Create a Home Valuation Report for This Property
The Home Valuation Report is an in-depth analysis detailing your home's value as well as a comparison with similar homes in the area
Home Values in the Area
Average Home Value in this Area
Purchase History
| Date | Buyer | Sale Price | Title Company |
|---|---|---|---|
| Zullo 3Rd Alfred J | $180,000 | -- |
Source: Public Records
Mortgage History
| Date | Status | Borrower | Loan Amount |
|---|---|---|---|
| Open | Zullo 3Rd Alfred J | $135,000 | |
| Closed | Zullo 3Rd Alfred J | $162,000 | |
| Previous Owner | Zullo 3Rd Alfred J | $25,000 |
Source: Public Records
Tax History Compared to Growth
Tax History
| Year | Tax Paid | Tax Assessment Tax Assessment Total Assessment is a certain percentage of the fair market value that is determined by local assessors to be the total taxable value of land and additions on the property. | Land | Improvement |
|---|---|---|---|---|
| 2025 | $4,249 | $127,050 | $45,570 | $81,480 |
| 2024 | $4,249 | $127,050 | $45,570 | $81,480 |
| 2023 | $3,964 | $127,050 | $45,570 | $81,480 |
| 2022 | $3,964 | $127,050 | $45,570 | $81,480 |
| 2021 | $3,760 | $109,790 | $42,040 | $67,750 |
| 2020 | $3,760 | $109,790 | $42,040 | $67,750 |
| 2019 | $3,559 | $109,790 | $42,040 | $67,750 |
| 2018 | $3,563 | $109,790 | $42,040 | $67,750 |
| 2017 | $3,464 | $109,790 | $42,040 | $67,750 |
| 2016 | $3,402 | $107,830 | $42,040 | $65,790 |
| 2015 | $3,402 | $107,830 | $42,040 | $65,790 |
| 2014 | $3,456 | $107,830 | $42,040 | $65,790 |
Source: Public Records
Map
Nearby Homes
- 49 Foote Rd
- 34 River St
- 58 Edward St
- 39 High St
- 71 High St
- 2 Kirkham Ave
- 48 Bishop St
- 83 Hudson St
- 237 N High St
- 17 Guilford Ct
- 30 Bradley Ave
- 51 Francis St
- 93 Kimberly Ave
- 111 & 111A Laurel St
- 102 Vista Dr
- 26 Vista Dr
- 271 Monticello Dr
- 312 Monticello Dr
- 192 Monticello Dr Unit 192
- 216B Cosey Beach Ave