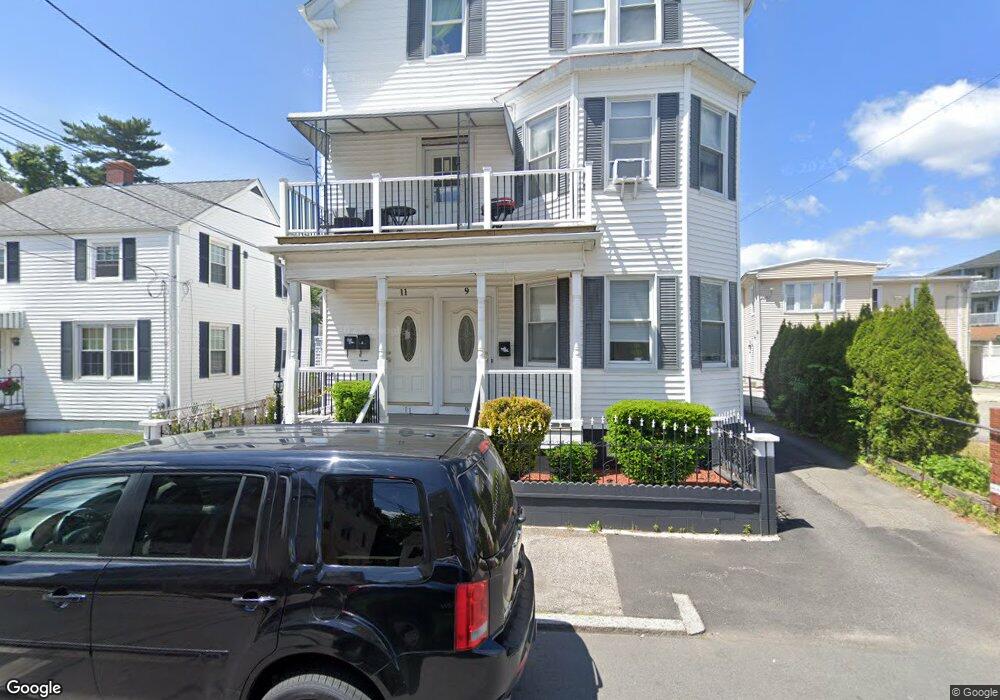
9 Deborah St Providence, RI 02909
Silver Lake NeighborhoodEstimated Value: $639,542 - $773,000
9
Beds
3
Baths
5,417
Sq Ft
$132/Sq Ft
Est. Value
About This Home
This home is located at 9 Deborah St, Providence, RI 02909 and is currently estimated at $715,386, approximately $132 per square foot. 9 Deborah St is a home located in Providence County with nearby schools including Achievement First Promesa, Achievement First Providence Mayoral Academy Elementary School, and Achievement First Providence Mayoral Academy Elementary.
Ownership History
Date
Name
Owned For
Owner Type
Purchase Details
Closed on
Aug 29, 2005
Sold by
Spinola Domingos R and Spinola Marta I
Bought by
Rosenzwaig Angela and Turner Ricardo
Current Estimated Value
Home Financials for this Owner
Home Financials are based on the most recent Mortgage that was taken out on this home.
Original Mortgage
$296,000
Outstanding Balance
$155,692
Interest Rate
5.68%
Mortgage Type
Purchase Money Mortgage
Estimated Equity
$559,694
Create a Home Valuation Report for This Property
The Home Valuation Report is an in-depth analysis detailing your home's value as well as a comparison with similar homes in the area
Home Values in the Area
Average Home Value in this Area
Purchase History
| Date | Buyer | Sale Price | Title Company |
|---|---|---|---|
| Rosenzwaig Angela | $370,000 | -- |
Source: Public Records
Mortgage History
| Date | Status | Borrower | Loan Amount |
|---|---|---|---|
| Open | Rosenzwaig Angela | $19,416 | |
| Open | Rosenzwaig Angela | $296,000 | |
| Closed | Rosenzwaig Angela | $74,000 |
Source: Public Records
Tax History
| Year | Tax Paid | Tax Assessment Tax Assessment Total Assessment is a certain percentage of the fair market value that is determined by local assessors to be the total taxable value of land and additions on the property. | Land | Improvement |
|---|---|---|---|---|
| 2025 | $4,701 | $622,700 | $128,000 | $494,700 |
| 2024 | $7,496 | $408,500 | $72,000 | $336,500 |
| 2023 | $7,496 | $408,500 | $72,000 | $336,500 |
| 2022 | $7,271 | $408,500 | $72,000 | $336,500 |
| 2021 | $6,447 | $262,500 | $45,800 | $216,700 |
| 2020 | $6,447 | $262,500 | $45,800 | $216,700 |
| 2019 | $6,447 | $262,500 | $45,800 | $216,700 |
| 2018 | $5,519 | $172,700 | $44,400 | $128,300 |
| 2017 | $5,519 | $172,700 | $44,400 | $128,300 |
| 2016 | $5,519 | $172,700 | $44,400 | $128,300 |
| 2015 | $4,416 | $133,400 | $47,100 | $86,300 |
| 2014 | $4,502 | $133,400 | $47,100 | $86,300 |
| 2013 | $4,502 | $133,400 | $47,100 | $86,300 |
Source: Public Records
Map
Nearby Homes
- 64 Ralph St
- 122 Laban St
- 173 Whittier Ave
- 29 Dunford St
- 140 Cleveland St
- 108 Roosevelt St
- 240 Eastwood Ave
- 15 Judith St
- 17 Judith St
- 160 Magnolia St
- 4 Priscilla Ave
- 41 Terrace Ave
- 231 Lowell Ave
- 18 Crowninshield St
- 79 Priscilla Ave
- 66 Progress Ave
- 665 Plainfield St
- 11 Hillhurst Ave
- 68 Murray St
- 29 Matson Ave Unit 35
Your Personal Tour Guide
Ask me questions while you tour the home.