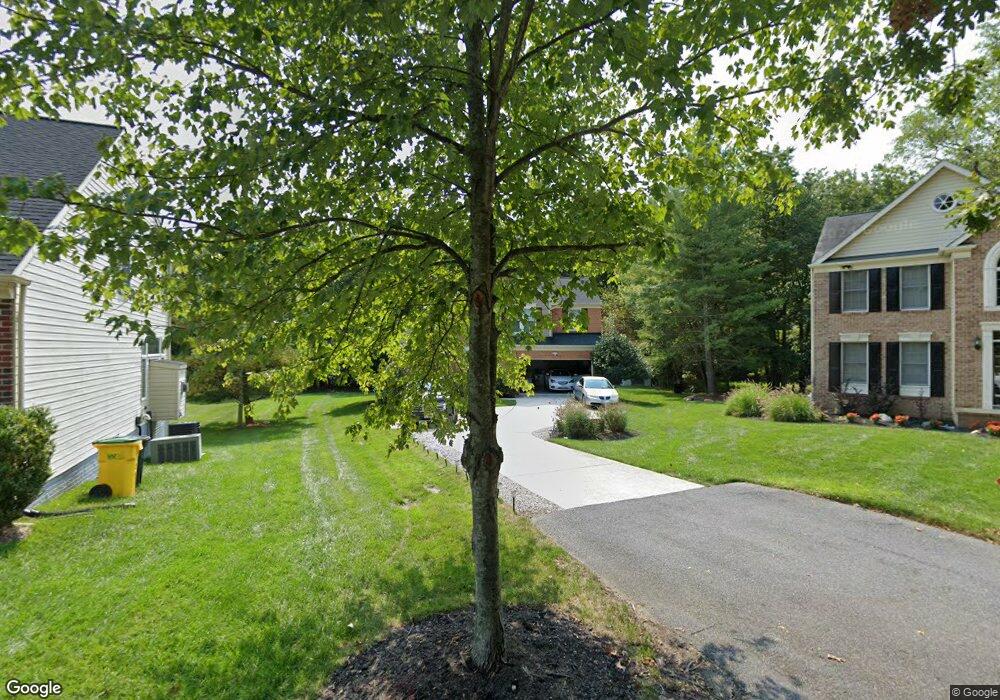
9 Devlon Ct Owings Mills, MD 21117
Estimated Value: $492,000 - $550,000
Studio
3
Baths
1,850
Sq Ft
$279/Sq Ft
Est. Value
About This Home
This home is located at 9 Devlon Ct, Owings Mills, MD 21117 and is currently estimated at $516,497, approximately $279 per square foot. 9 Devlon Ct is a home located in Baltimore County with nearby schools including Lyons Mill Elementary School, Northwest Academy of Health Sciences, and New Town High.
Ownership History
Date
Name
Owned For
Owner Type
Purchase Details
Closed on
Feb 9, 2019
Sold by
Alexander James S and Alexander Wendy E
Bought by
Alexander James S and Alexander Wendy E
Current Estimated Value
Home Financials for this Owner
Home Financials are based on the most recent Mortgage that was taken out on this home.
Original Mortgage
$341,000
Outstanding Balance
$299,189
Interest Rate
4.4%
Mortgage Type
VA
Estimated Equity
$217,308
Purchase Details
Closed on
Feb 19, 2002
Sold by
Izzo Wallace J
Bought by
Alexander James E and Alexander Wendy E
Purchase Details
Closed on
Jan 10, 2002
Sold by
Foreman Joseph B
Bought by
Izzo Wallace J and Izzo Rebecca
Purchase Details
Closed on
Nov 23, 1998
Sold by
Nvr Inc
Bought by
Foreman Joseph B and Foreman Carol F
Purchase Details
Closed on
Nov 6, 1998
Sold by
Black Horse Run Joint Venture
Bought by
Nvr Inc
Create a Home Valuation Report for This Property
The Home Valuation Report is an in-depth analysis detailing your home's value as well as a comparison with similar homes in the area
Home Values in the Area
Average Home Value in this Area
Purchase History
| Date | Buyer | Sale Price | Title Company |
|---|---|---|---|
| Alexander James S | -- | Unisource | |
| Alexander James E | $267,000 | -- | |
| Izzo Wallace J | $194,900 | -- | |
| Foreman Joseph B | $171,740 | -- | |
| Nvr Inc | $57,500 | -- |
Source: Public Records
Mortgage History
| Date | Status | Borrower | Loan Amount |
|---|---|---|---|
| Open | Alexander James S | $341,000 |
Source: Public Records
Tax History
| Year | Tax Paid | Tax Assessment Tax Assessment Total Assessment is a certain percentage of the fair market value that is determined by local assessors to be the total taxable value of land and additions on the property. | Land | Improvement |
|---|---|---|---|---|
| 2025 | $60 | $380,533 | -- | -- |
| 2024 | $60 | $347,400 | $102,500 | $244,900 |
| 2023 | $30 | $332,667 | $0 | $0 |
| 2022 | $60 | $317,933 | $0 | $0 |
| 2021 | $4,665 | $303,200 | $102,500 | $200,700 |
| 2020 | $4,665 | $297,000 | $0 | $0 |
| 2019 | $4,467 | $290,800 | $0 | $0 |
| 2018 | $4,626 | $284,600 | $102,500 | $182,100 |
| 2017 | $4,102 | $271,100 | $0 | $0 |
| 2016 | $5,255 | $257,600 | $0 | $0 |
| 2015 | $5,255 | $244,100 | $0 | $0 |
| 2014 | $5,255 | $244,100 | $0 | $0 |
Source: Public Records
Map
Nearby Homes
- 4228 Brookside Oaks
- 4450 Potts Ct Unit 575
- 9228 Owings Choice Ct
- 9435 James MacGowan Ln Unit 439
- 9130 Marlove Oaks Ln
- 9129 Marlove Oaks Ln
- 9374 Seney Ln Unit 567
- 9378 Seney Ln
- 9434 Davy Ln Unit 474
- 9306 Leigh Choice Ct
- 9452 Davy Ln Unit 467
- 9424 Adelaide Ln
- 9104 Marlove Oaks Ln
- 9442 Adelaide Ln
- 4112 Spider Lily Way
- 1205/99 Winands Rd
- 4504 Donatello Square
- 8811 Stoneridge Cir Unit 103
- 4516 Donatello Square
- 8905 Stone Creek Place Unit 201
Your Personal Tour Guide
Ask me questions while you tour the home.