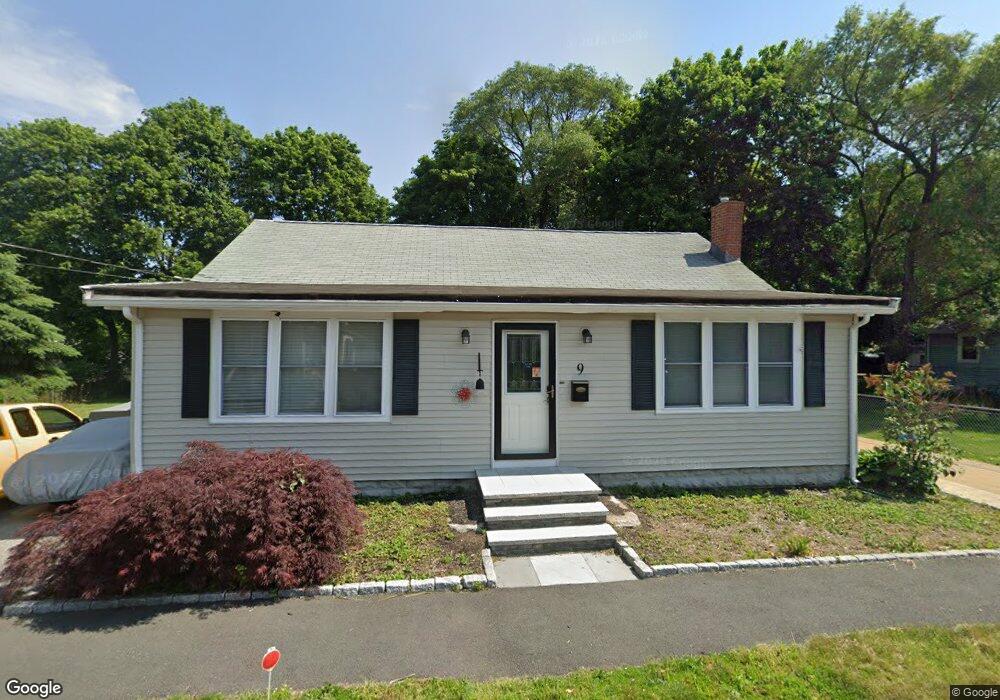
9 Dexter St Peabody, MA 01960
South Peabody NeighborhoodEstimated Value: $576,000 - $652,000
2
Beds
2
Baths
1,164
Sq Ft
$527/Sq Ft
Est. Value
About This Home
This home is located at 9 Dexter St, Peabody, MA 01960 and is currently estimated at $612,908, approximately $526 per square foot. 9 Dexter St is a home located in Essex County with nearby schools including Peabody Veterans Memorial High School, St John The Baptist School, and North Shore Christian School.
Ownership History
Date
Name
Owned For
Owner Type
Purchase Details
Closed on
May 30, 2001
Sold by
Rydzewski Joseph S and Rydzewski Lisa
Bought by
Kirkness Roger and Kirkness Holly
Current Estimated Value
Purchase Details
Closed on
Sep 1, 1987
Sold by
Standley Gary F
Bought by
Rydzewski Joseph S
Create a Home Valuation Report for This Property
The Home Valuation Report is an in-depth analysis detailing your home's value as well as a comparison with similar homes in the area
Home Values in the Area
Average Home Value in this Area
Purchase History
| Date | Buyer | Sale Price | Title Company |
|---|---|---|---|
| Kirkness Roger | $238,000 | -- | |
| Rydzewski Joseph S | $165,000 | -- |
Source: Public Records
Mortgage History
| Date | Status | Borrower | Loan Amount |
|---|---|---|---|
| Open | Rydzewski Joseph S | $234,127 | |
| Closed | Rydzewski Joseph S | $20,000 | |
| Closed | Rydzewski Joseph S | $253,000 |
Source: Public Records
Tax History Compared to Growth
Tax History
| Year | Tax Paid | Tax Assessment Tax Assessment Total Assessment is a certain percentage of the fair market value that is determined by local assessors to be the total taxable value of land and additions on the property. | Land | Improvement |
|---|---|---|---|---|
| 2025 | $5,052 | $545,600 | $247,400 | $298,200 |
| 2024 | $4,732 | $518,900 | $247,400 | $271,500 |
| 2023 | $4,681 | $491,700 | $220,900 | $270,800 |
| 2022 | $4,164 | $412,300 | $197,300 | $215,000 |
| 2021 | $4,213 | $401,600 | $179,400 | $222,200 |
| 2020 | $4,136 | $385,100 | $179,400 | $205,700 |
| 2019 | $3,687 | $334,900 | $179,400 | $155,500 |
| 2018 | $3,618 | $315,700 | $163,000 | $152,700 |
| 2017 | $3,215 | $273,400 | $163,000 | $110,400 |
| 2016 | $2,973 | $249,400 | $163,000 | $86,400 |
| 2015 | $2,984 | $242,600 | $159,000 | $83,600 |
Source: Public Records
Map
Nearby Homes
- 41 Dexter St
- 30 Saint Ann's Ave
- 3 Veterans Memorial Dr
- 6 Christopher Terrace
- 5 Quarry Terrace
- 60 Lynn St
- 232 Lynn St
- 29 Rockway Rd
- 34 Glendale Ave
- 5 Louis Rd
- 17 Janet Ln
- 39 Graves Rd
- 69 Saunders Rd
- 35 Oak Ridge Cir
- 85 Range Ave
- 17 Lions Ln
- 6 Countryside Ln Unit 1303
- 21 Chanelle Cir
- 31 Spring View Dr
- 12 Tanglewood Ln Unit 12