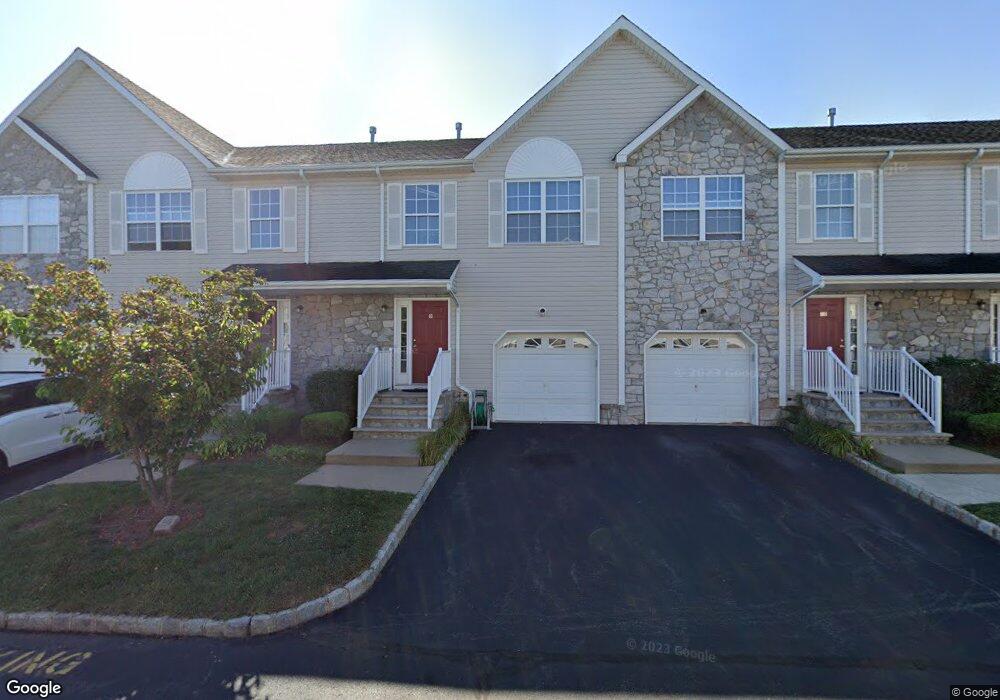
9 Dina Ln Unit 9 Somerset, NJ 08873
Estimated Value: $508,000 - $549,000
3
Beds
3
Baths
1,488
Sq Ft
$356/Sq Ft
Est. Value
About This Home
This home is located at 9 Dina Ln Unit 9, Somerset, NJ 08873 and is currently estimated at $529,386, approximately $355 per square foot. 9 Dina Ln Unit 9 is a home located in Somerset County with nearby schools including Franklin High School, Cheder Menachem, and St. Augustine of Canterbury School.
Ownership History
Date
Name
Owned For
Owner Type
Purchase Details
Closed on
Oct 2, 2008
Sold by
Gangasani Pallavi R
Bought by
Sunku Reena
Current Estimated Value
Purchase Details
Closed on
Sep 1, 2004
Sold by
Franklin Somerset Developers L
Bought by
Gangasani Pallavi R
Home Financials for this Owner
Home Financials are based on the most recent Mortgage that was taken out on this home.
Original Mortgage
$255,920
Interest Rate
6.01%
Create a Home Valuation Report for This Property
The Home Valuation Report is an in-depth analysis detailing your home's value as well as a comparison with similar homes in the area
Home Values in the Area
Average Home Value in this Area
Purchase History
| Date | Buyer | Sale Price | Title Company |
|---|---|---|---|
| Sunku Reena | $300,000 | Nj Title Insurance Company | |
| Gangasani Pallavi R | $319,900 | -- |
Source: Public Records
Mortgage History
| Date | Status | Borrower | Loan Amount |
|---|---|---|---|
| Previous Owner | Gangasani Pallavi R | $255,920 |
Source: Public Records
Tax History Compared to Growth
Tax History
| Year | Tax Paid | Tax Assessment Tax Assessment Total Assessment is a certain percentage of the fair market value that is determined by local assessors to be the total taxable value of land and additions on the property. | Land | Improvement |
|---|---|---|---|---|
| 2025 | $7,425 | $487,600 | $190,000 | $297,600 |
| 2024 | $7,425 | $411,800 | $190,000 | $221,800 |
| 2023 | $7,338 | $381,800 | $160,000 | $221,800 |
| 2022 | $6,729 | $331,800 | $110,000 | $221,800 |
| 2021 | $6,216 | $296,800 | $75,000 | $221,800 |
| 2020 | $6,366 | $281,800 | $60,000 | $221,800 |
| 2019 | $6,216 | $271,800 | $50,000 | $221,800 |
| 2018 | $6,175 | $267,300 | $50,000 | $217,300 |
| 2017 | $6,199 | $267,300 | $50,000 | $217,300 |
| 2016 | $6,252 | $267,300 | $50,000 | $217,300 |
| 2015 | $6,024 | $259,300 | $42,000 | $217,300 |
| 2014 | $5,910 | $258,300 | $41,000 | $217,300 |
Source: Public Records
Map
Nearby Homes