K
Seller's Agent in 2015
Kate Plummer
Today Real Estate
(508) 568-8222
59 Total Sales


Estimated Value: $592,000 - $1,114,000
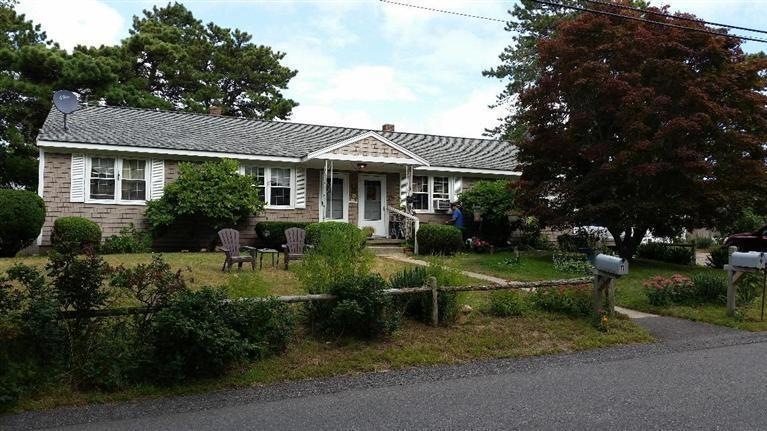
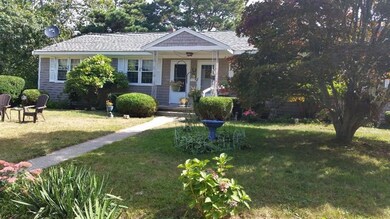
Great Investment Opportunity!! South of 28 Duplex with Two Bedrooms on Each Side and Full Basement. Just about half mile to beautiful beach on Nantucket Sound. Roof installed 2013
Last Agent to Sell the Property
Today Real Estate License #133404 Listed on: 09/09/2014
| Date | Buyer | Sale Price | Title Company |
|---|---|---|---|
| Stinson Wesley C | $257,000 | -- | |
| Trippier Joel M | $215,000 | -- | |
| Trippier Joel M | $215,000 | -- |
| Date | Status | Borrower | Loan Amount |
|---|---|---|---|
| Open | Stinson Wesley C | $205,600 | |
| Closed | Trippier Joel M | $205,600 | |
| Previous Owner | Trippier Joel M | $193,500 |
| Date | Event | Price | Change | Sq Ft Price |
|---|---|---|---|---|
| 02/11/2015 02/11/15 | Sold | $257,000 | -14.3% | $153 / Sq Ft |
| 02/09/2015 02/09/15 | Pending | -- | -- | -- |
| 09/09/2014 09/09/14 | For Sale | $299,900 | -- | $179 / Sq Ft |
| Year | Tax Paid | Tax Assessment Tax Assessment Total Assessment is a certain percentage of the fair market value that is determined by local assessors to be the total taxable value of land and additions on the property. | Land | Improvement |
|---|---|---|---|---|
| 2025 | $3,717 | $629,000 | $384,700 | $244,300 |
| 2024 | $3,376 | $559,900 | $325,700 | $234,200 |
| 2023 | $3,027 | $455,800 | $253,800 | $202,000 |
| 2022 | $3,353 | $413,500 | $257,500 | $156,000 |
| 2021 | $3,253 | $378,300 | $234,100 | $144,200 |
| 2020 | $3,215 | $368,300 | $226,200 | $142,100 |
| 2019 | $2,974 | $343,000 | $203,500 | $139,500 |
| 2018 | $2,846 | $314,000 | $185,000 | $129,000 |
| 2017 | $2,735 | $304,900 | $177,900 | $127,000 |
| 2016 | $2,718 | $299,700 | $177,900 | $121,800 |
| 2015 | $2,802 | $312,400 | $174,400 | $138,000 |
| 2014 | $2,806 | $320,000 | $169,200 | $150,800 |
K
Seller's Agent in 2015
Kate Plummer
Today Real Estate
(508) 568-8222
59 Total Sales

Buyer's Agent in 2015
Susan Peterson
Today Real Estate
(774) 722-0498
6 in this area
42 Total Sales
Source: Cape Cod & Islands Association of REALTORS®
MLS Number: 21408561
APN: HARW-000001-000000-A000001-000004
Disclaimer: Certain information contained herein is derived from information provided by parties other than Homes.com. All information provided is deemed reliable, but is not guaranteed to be accurate and should be independently verified.
![]() All data relating to real estate for sale on this page comes from the Broker Reciprocity (BR) of the Cape Cod & Islands Multiple Listing Service, Inc. Detailed information about real estate listings held by brokerage firms other than CC&I Assoc. of REALTORS®, Inc. includes the name of the listing company. Neither the listing company nor CC&I Assoc. of REALTORS®, Inc. shall be responsible for any typographical errors, misinformation, misprints and shall be held totally harmless. The Broker providing this data believes it to be correct, but advises interested parties to confirm any item before relying on it in a purchase decision. All properties are subject to prior sale, changes, or withdrawal. Copyright 2025 © Cape Cod & Islands Multiple Listing Service, Inc. All rights reserved.
All data relating to real estate for sale on this page comes from the Broker Reciprocity (BR) of the Cape Cod & Islands Multiple Listing Service, Inc. Detailed information about real estate listings held by brokerage firms other than CC&I Assoc. of REALTORS®, Inc. includes the name of the listing company. Neither the listing company nor CC&I Assoc. of REALTORS®, Inc. shall be responsible for any typographical errors, misinformation, misprints and shall be held totally harmless. The Broker providing this data believes it to be correct, but advises interested parties to confirm any item before relying on it in a purchase decision. All properties are subject to prior sale, changes, or withdrawal. Copyright 2025 © Cape Cod & Islands Multiple Listing Service, Inc. All rights reserved.