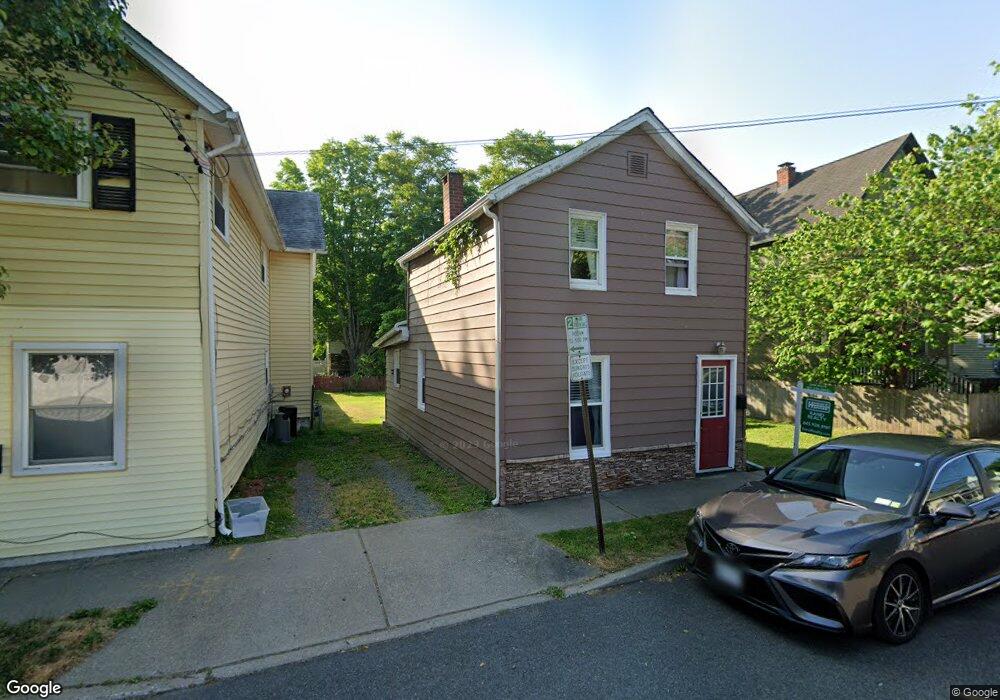
9 Duncan Ave Cornwall On Hudson, NY 12520
Estimated Value: $341,000 - $746,000
4
Beds
2
Baths
3,218
Sq Ft
$154/Sq Ft
Est. Value
About This Home
This home is located at 9 Duncan Ave, Cornwall On Hudson, NY 12520 and is currently estimated at $494,964, approximately $153 per square foot. 9 Duncan Ave is a home located in Orange County with nearby schools including Cornwall Central Middle School, Little Harvard, and San Miguel Academy Of Newburgh.
Ownership History
Date
Name
Owned For
Owner Type
Purchase Details
Closed on
Sep 2, 2021
Sold by
Agudo Jose and Agudo Angela
Bought by
Johnson Howard and Johnson Tijuana
Current Estimated Value
Home Financials for this Owner
Home Financials are based on the most recent Mortgage that was taken out on this home.
Original Mortgage
$364,000
Outstanding Balance
$328,273
Interest Rate
2.7%
Mortgage Type
Stand Alone Refi Refinance Of Original Loan
Estimated Equity
$166,691
Purchase Details
Closed on
Oct 31, 2007
Sold by
O'Toole Seamus
Bought by
Kirkland Iman
Purchase Details
Closed on
Oct 6, 2006
Sold by
Heaney John G
Bought by
O'Toole Seamus
Purchase Details
Closed on
Dec 17, 2001
Sold by
Gallo Herman Donna Lee and Murray Donna
Bought by
Heaney John G
Home Financials for this Owner
Home Financials are based on the most recent Mortgage that was taken out on this home.
Original Mortgage
$188,400
Interest Rate
6.61%
Mortgage Type
FHA
Create a Home Valuation Report for This Property
The Home Valuation Report is an in-depth analysis detailing your home's value as well as a comparison with similar homes in the area
Home Values in the Area
Average Home Value in this Area
Purchase History
| Date | Buyer | Sale Price | Title Company |
|---|---|---|---|
| Johnson Howard | $510,000 | None Available | |
| Johnson Howard | $510,000 | None Available | |
| Kirkland Iman | $265,000 | Andrew Maggio | |
| Kirkland Iman | $265,000 | Andrew Maggio | |
| O'Toole Seamus | $345,000 | Michael F King | |
| O'Toole Seamus | $345,000 | Michael F King | |
| Heaney John G | $189,900 | -- | |
| Heaney John G | $189,900 | -- |
Source: Public Records
Mortgage History
| Date | Status | Borrower | Loan Amount |
|---|---|---|---|
| Open | Johnson Howard | $364,000 | |
| Closed | Johnson Howard | $364,000 | |
| Previous Owner | Heaney John G | $188,400 |
Source: Public Records
Tax History Compared to Growth
Tax History
| Year | Tax Paid | Tax Assessment Tax Assessment Total Assessment is a certain percentage of the fair market value that is determined by local assessors to be the total taxable value of land and additions on the property. | Land | Improvement |
|---|---|---|---|---|
| 2024 | $10,683 | $265,800 | $82,200 | $183,600 |
| 2023 | $10,683 | $265,800 | $82,200 | $183,600 |
| 2022 | $10,605 | $265,800 | $82,200 | $183,600 |
| 2021 | $8,398 | $265,800 | $82,200 | $183,600 |
| 2020 | $7,656 | $265,800 | $82,200 | $183,600 |
| 2019 | $7,454 | $265,800 | $82,200 | $183,600 |
| 2018 | $7,454 | $265,800 | $82,200 | $183,600 |
| 2017 | $7,313 | $265,800 | $82,200 | $183,600 |
| 2016 | $5,596 | $147,700 | $17,400 | $130,300 |
| 2015 | -- | $147,700 | $17,400 | $130,300 |
| 2014 | -- | $147,700 | $17,400 | $130,300 |
Source: Public Records
Map
Nearby Homes
- 11 Duncan Ave
- 241 Hudson St
- 245 Hudson St Unit 3
- 245 Hudson St Unit 1
- 245 Hudson St Unit 2
- 245 Hudson St
- 13 Duncan Ave
- 10 Maple Ave
- 243 Hudson St
- 243 Hudson St Unit 2
- 247 Hudson St Unit 6
- 255 Hudson St
- 15 Duncan Ave
- 14 Maple Ave Unit 2
- 12-14 Maple Ave Unit 12-1
- 12-14 Maple Ave Unit 14-2
- 12 Maple Ave
- 12 Maple Ave Unit 12-1
- 12 Maple Ave Unit 14-2
- 14 Maple Ave