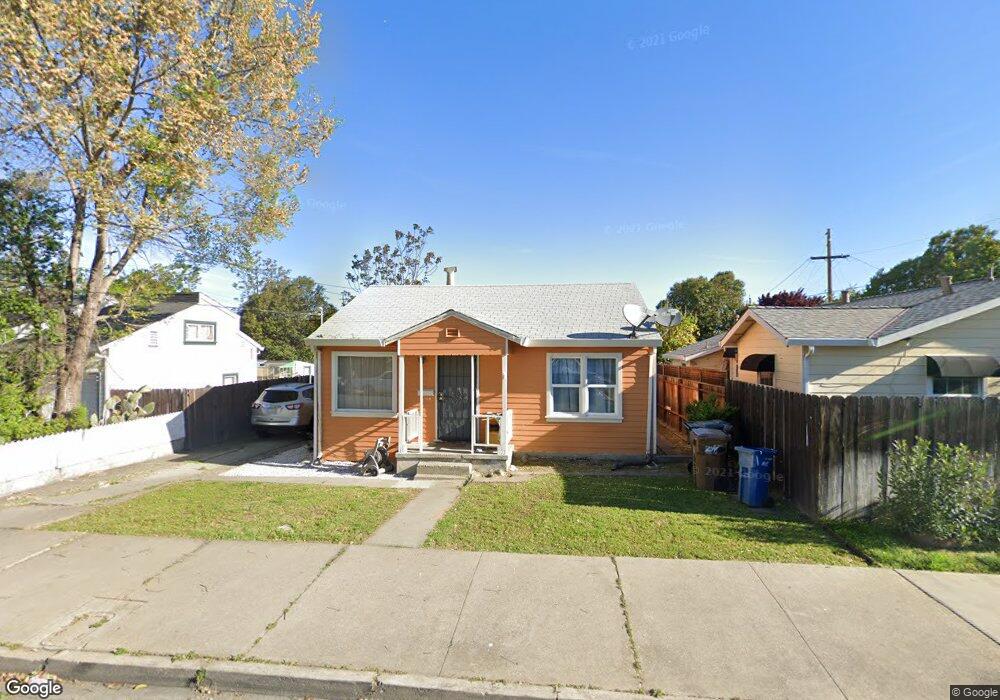
9 E 13th St Antioch, CA 94509
North Antioch NeighborhoodEstimated Value: $352,000 - $421,000
2
Beds
1
Bath
761
Sq Ft
$503/Sq Ft
Est. Value
About This Home
This home is located at 9 E 13th St, Antioch, CA 94509 and is currently estimated at $382,583, approximately $502 per square foot. 9 E 13th St is a home located in Contra Costa County with nearby schools including Kimball Elementary School, Antioch Middle School, and Antioch High School.
Ownership History
Date
Name
Owned For
Owner Type
Purchase Details
Closed on
Dec 28, 2016
Sold by
Heaton Olivia V
Bought by
Zabala Jose De Jesus Sanchez and Sanchez Maria Praxedes A
Current Estimated Value
Home Financials for this Owner
Home Financials are based on the most recent Mortgage that was taken out on this home.
Original Mortgage
$171,830
Outstanding Balance
$140,870
Interest Rate
3.94%
Mortgage Type
FHA
Estimated Equity
$241,713
Purchase Details
Closed on
Jun 26, 2007
Sold by
Heaton Robert L
Bought by
Heaton Olivia
Purchase Details
Closed on
Aug 14, 2003
Sold by
Silva Raymond R
Bought by
Heaton Robert L and Heaton Oliva
Create a Home Valuation Report for This Property
The Home Valuation Report is an in-depth analysis detailing your home's value as well as a comparison with similar homes in the area
Home Values in the Area
Average Home Value in this Area
Purchase History
| Date | Buyer | Sale Price | Title Company |
|---|---|---|---|
| Zabala Jose De Jesus Sanchez | $175,000 | First American Title Company | |
| Heaton Olivia | -- | None Available | |
| Heaton Robert L | -- | -- |
Source: Public Records
Mortgage History
| Date | Status | Borrower | Loan Amount |
|---|---|---|---|
| Open | Zabala Jose De Jesus Sanchez | $171,830 |
Source: Public Records
Tax History
| Year | Tax Paid | Tax Assessment Tax Assessment Total Assessment is a certain percentage of the fair market value that is determined by local assessors to be the total taxable value of land and additions on the property. | Land | Improvement |
|---|---|---|---|---|
| 2025 | $2,770 | $203,096 | $113,153 | $89,943 |
| 2024 | $2,611 | $199,115 | $110,935 | $88,180 |
| 2023 | $2,611 | $195,211 | $108,760 | $86,451 |
| 2022 | $2,573 | $191,384 | $106,628 | $84,756 |
| 2021 | $2,471 | $187,633 | $104,538 | $83,095 |
| 2019 | $2,424 | $182,070 | $101,439 | $80,631 |
| 2018 | $2,338 | $178,500 | $99,450 | $79,050 |
| 2017 | $2,273 | $175,000 | $97,500 | $77,500 |
| 2016 | $2,459 | $187,000 | $91,468 | $95,532 |
| 2015 | $2,053 | $150,500 | $73,614 | $76,886 |
| 2014 | $1,554 | $108,500 | $53,071 | $55,429 |
Source: Public Records
Map
Nearby Homes
Your Personal Tour Guide
Ask me questions while you tour the home.