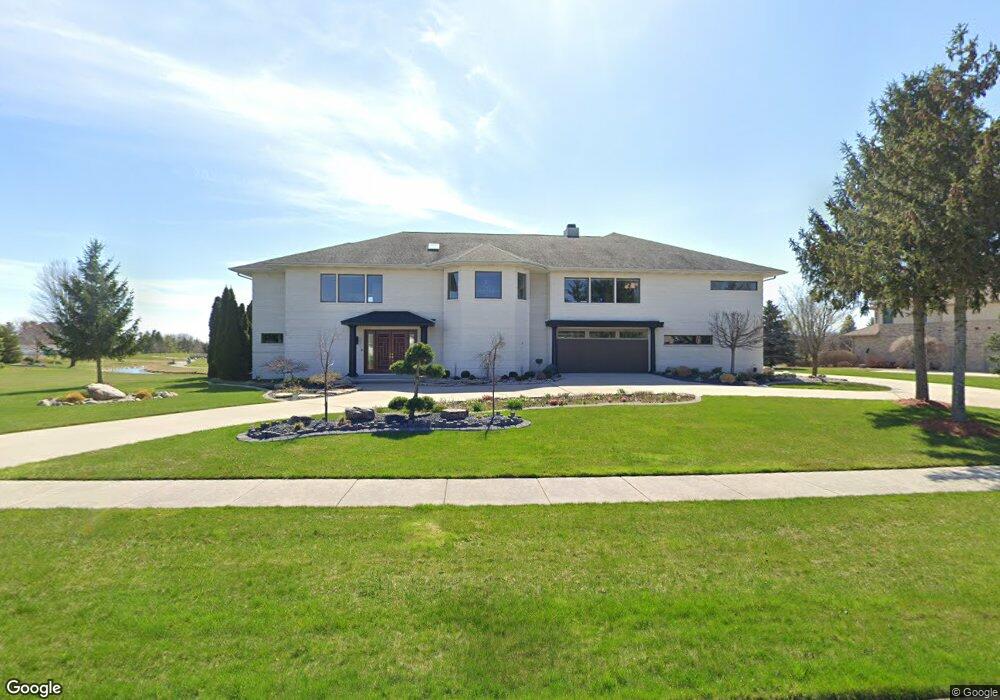
9 E Grove Ct Unit 38 Freeland, MI 48623
Estimated Value: $840,000 - $1,031,000
5
Beds
5
Baths
6,284
Sq Ft
$150/Sq Ft
Est. Value
About This Home
This home is located at 9 E Grove Ct Unit 38, Freeland, MI 48623 and is currently estimated at $941,374, approximately $149 per square foot. 9 E Grove Ct Unit 38 is a home located in Saginaw County with nearby schools including Freeland Learning Center, Freeland Elementary School, and Freeland Middle/High School.
Ownership History
Date
Name
Owned For
Owner Type
Purchase Details
Closed on
Dec 7, 2021
Sold by
Parashar Sunil
Bought by
Faulk Sherwin and Faulk Marie L
Current Estimated Value
Purchase Details
Closed on
Mar 31, 2017
Sold by
Naram Krishna
Bought by
Parashar Sunil
Home Financials for this Owner
Home Financials are based on the most recent Mortgage that was taken out on this home.
Original Mortgage
$540,000
Interest Rate
4.1%
Mortgage Type
New Conventional
Purchase Details
Closed on
Apr 4, 2013
Sold by
Naram Krishna and Naram Ramesh
Bought by
Naram Krishna and Krishna Naram Declaration Of Trust Dated
Home Financials for this Owner
Home Financials are based on the most recent Mortgage that was taken out on this home.
Original Mortgage
$360,990
Interest Rate
3.5%
Mortgage Type
New Conventional
Purchase Details
Closed on
Jan 15, 1999
Sold by
Provenzano Anthony F and Provenzano Jo Ellen
Bought by
Naram Ramesh and Naram Krishna
Purchase Details
Closed on
Jan 15, 1998
Create a Home Valuation Report for This Property
The Home Valuation Report is an in-depth analysis detailing your home's value as well as a comparison with similar homes in the area
Home Values in the Area
Average Home Value in this Area
Purchase History
| Date | Buyer | Sale Price | Title Company |
|---|---|---|---|
| Faulk Sherwin | $715,000 | Title Resource Agency | |
| Parashar Sunil | -- | None Available | |
| Naram Krishna | -- | -- | |
| Naram Ramesh | $106,000 | -- | |
| -- | $106,000 | -- |
Source: Public Records
Mortgage History
| Date | Status | Borrower | Loan Amount |
|---|---|---|---|
| Previous Owner | Parashar Sunil | $540,000 | |
| Previous Owner | Naram Krishna | $360,990 |
Source: Public Records
Tax History
| Year | Tax Paid | Tax Assessment Tax Assessment Total Assessment is a certain percentage of the fair market value that is determined by local assessors to be the total taxable value of land and additions on the property. | Land | Improvement |
|---|---|---|---|---|
| 2025 | $4,490 | $409,900 | $0 | $0 |
| 2024 | $4,355 | $400,000 | $0 | $0 |
| 2023 | $4,147 | $387,000 | $0 | $0 |
| 2022 | $11,690 | $360,500 | $0 | $0 |
| 2021 | $18,358 | $405,500 | $0 | $0 |
| 2020 | $17,948 | $396,600 | $0 | $0 |
| 2019 | $10,652 | $374,300 | $76,400 | $297,900 |
| 2018 | $3,990 | $363,900 | $0 | $0 |
| 2017 | $9,933 | $397,900 | $0 | $0 |
| 2016 | $9,840 | $396,800 | $0 | $0 |
| 2014 | -- | $368,000 | $0 | $307,900 |
| 2013 | -- | $450,800 | $0 | $0 |
Source: Public Records
Map
Nearby Homes
- 23 E Grove Ct
- Lot 72 E Grove Ct
- 17 E Grove Ct
- 72 E Grove Ct
- 34 W Grove Ct
- 12 W Grove Ct Unit 19
- 34 W Grove Lot Ct
- 4535 N River Rd
- 4125 Village Green Dr
- 4265 Village Green
- 4219 Village Green
- 4132 Meadowbrook Dr
- 5120 Midland Rd
- 4169 Mountain View Ct
- 4202 Lone Rd
- 3919 N River Rd
- 0 Hornbeam Ln
- 5663 Stone Briar Ln S
- 5760 Stone Briar Ln S
- TBD Garfield Rd
- 9 E Grove Ct
- 7 W Grove Ct
- 24 E Grove Ct
- 22 E Grove Ct
- 7 E Grove Ct Unit 37
- 000 E Grove
- E Grove
- 12 E Grove Ct Unit 67
- 14 E Grove
- 5 E Grove Ct
- 14 E Grove Ct Unit 66
- 10 E Grove Ct Unit 51
- 10 E Grove Ct Unit 51
- 10 E Grove Ct Unit 58
- 10 E Grove Ct
- 10 E Grove
- 13 E Grove Ct Unit 33
- 13 E Grove
- 2 Appleshire Ct Unit 57
- 11 E Grove Ct Unit Bldg-Unit
Your Personal Tour Guide
Ask me questions while you tour the home.