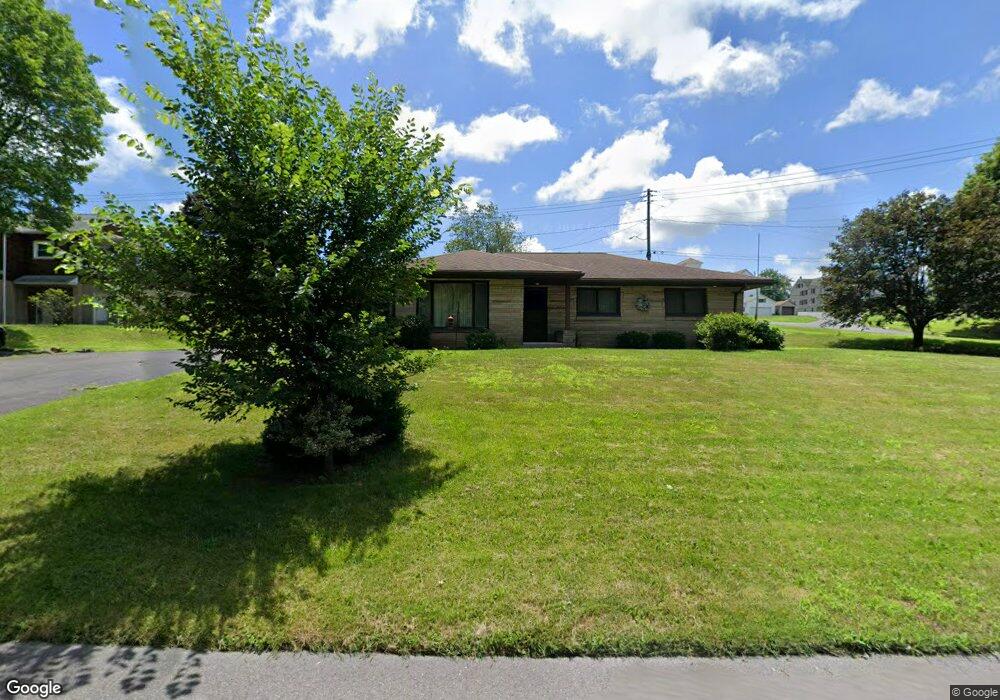
9 E North St Summit Hill, PA 18250
Estimated Value: $216,976 - $247,000
3
Beds
1
Bath
1,328
Sq Ft
$174/Sq Ft
Est. Value
About This Home
This home is located at 9 E North St, Summit Hill, PA 18250 and is currently estimated at $230,494, approximately $173 per square foot. 9 E North St is a home located in Carbon County with nearby schools including Panther Valley Intermediate School, Panther Valley Elementary School, and Panther Valley Junior/Senior High School.
Ownership History
Date
Name
Owned For
Owner Type
Purchase Details
Closed on
Apr 26, 2021
Sold by
Papinsick John and Papinsick Alan
Bought by
Casten Charleton John and Mackerer Catherine M
Current Estimated Value
Home Financials for this Owner
Home Financials are based on the most recent Mortgage that was taken out on this home.
Original Mortgage
$172,887
Outstanding Balance
$156,186
Interest Rate
2.9%
Mortgage Type
VA
Estimated Equity
$74,308
Purchase Details
Closed on
Jan 22, 1996
Bought by
Papinsick Jean B and Papinsick John
Create a Home Valuation Report for This Property
The Home Valuation Report is an in-depth analysis detailing your home's value as well as a comparison with similar homes in the area
Home Values in the Area
Average Home Value in this Area
Purchase History
| Date | Buyer | Sale Price | Title Company |
|---|---|---|---|
| Casten Charleton John | $169,000 | Trident Land Transfer Co Lp | |
| Papinsick Jean B | -- | -- |
Source: Public Records
Mortgage History
| Date | Status | Borrower | Loan Amount |
|---|---|---|---|
| Open | Casten Charleton John | $172,887 |
Source: Public Records
Tax History Compared to Growth
Tax History
| Year | Tax Paid | Tax Assessment Tax Assessment Total Assessment is a certain percentage of the fair market value that is determined by local assessors to be the total taxable value of land and additions on the property. | Land | Improvement |
|---|---|---|---|---|
| 2025 | $4,818 | $50,751 | $6,550 | $44,201 |
| 2024 | $4,913 | $50,751 | $6,550 | $44,201 |
| 2023 | $4,837 | $50,751 | $6,550 | $44,201 |
| 2022 | $4,882 | $50,751 | $6,550 | $44,201 |
| 2021 | $2,770 | $28,800 | $6,550 | $22,250 |
| 2020 | $2,749 | $28,800 | $6,550 | $22,250 |
| 2019 | $2,550 | $28,800 | $6,550 | $22,250 |
| 2018 | $2,507 | $28,800 | $6,550 | $22,250 |
| 2017 | $2,478 | $28,800 | $6,550 | $22,250 |
| 2016 | -- | $28,800 | $6,550 | $22,250 |
| 2015 | -- | $28,800 | $6,550 | $22,250 |
| 2014 | -- | $28,800 | $6,550 | $22,250 |
Source: Public Records
Map
Nearby Homes