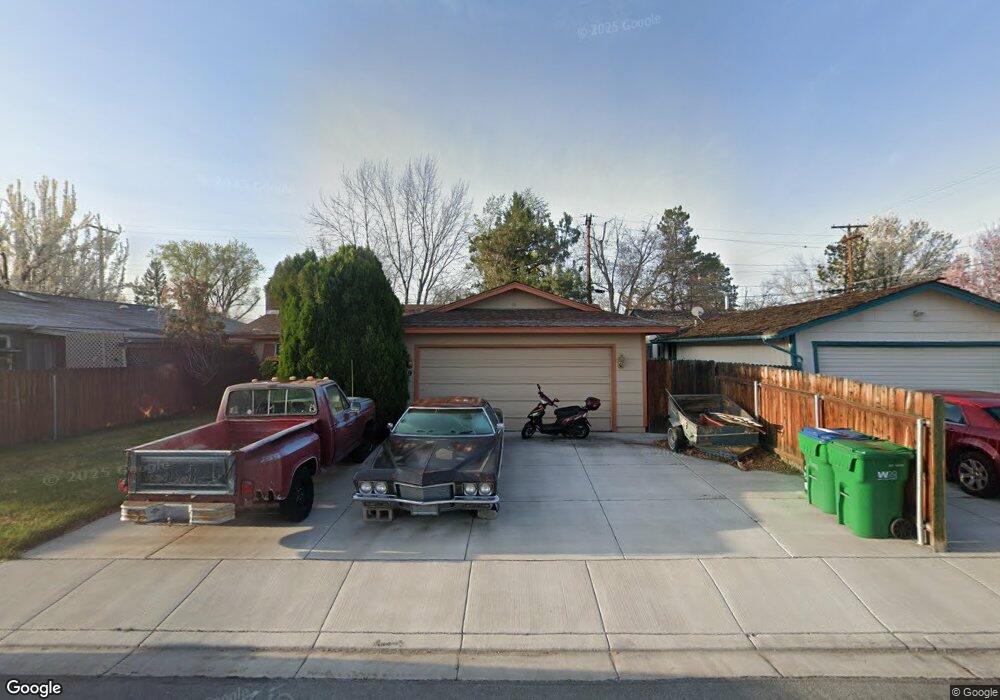
9 E Richards Way Sparks, NV 89431
McCarran Boulevard-Probasco NeighborhoodEstimated Value: $404,137 - $425,000
3
Beds
2
Baths
1,176
Sq Ft
$353/Sq Ft
Est. Value
About This Home
This home is located at 9 E Richards Way, Sparks, NV 89431 and is currently estimated at $415,034, approximately $352 per square foot. 9 E Richards Way is a home located in Washoe County with nearby schools including Greenbrae Elementary School, George L Dilworth Middle School, and Sparks High School.
Ownership History
Date
Name
Owned For
Owner Type
Purchase Details
Closed on
Dec 29, 1998
Sold by
Ferris Benjamin and Ferris Karmen S
Bought by
Ferris James R
Current Estimated Value
Home Financials for this Owner
Home Financials are based on the most recent Mortgage that was taken out on this home.
Original Mortgage
$102,600
Outstanding Balance
$22,308
Interest Rate
6.82%
Estimated Equity
$392,726
Purchase Details
Closed on
Apr 10, 1997
Sold by
Reno Barbara A and Roost Eric R T
Bought by
Ferris James and Ferris Benjamin
Home Financials for this Owner
Home Financials are based on the most recent Mortgage that was taken out on this home.
Original Mortgage
$103,937
Interest Rate
7.66%
Mortgage Type
FHA
Purchase Details
Closed on
Aug 6, 1994
Sold by
Reno Rodney L
Bought by
Reno Barbara A
Create a Home Valuation Report for This Property
The Home Valuation Report is an in-depth analysis detailing your home's value as well as a comparison with similar homes in the area
Home Values in the Area
Average Home Value in this Area
Purchase History
| Date | Buyer | Sale Price | Title Company |
|---|---|---|---|
| Ferris James R | -- | First American Title Co | |
| Ferris James | $105,000 | First Centennial Title Co | |
| Reno Barbara A | -- | -- |
Source: Public Records
Mortgage History
| Date | Status | Borrower | Loan Amount |
|---|---|---|---|
| Open | Ferris James R | $102,600 | |
| Closed | Ferris James | $103,937 |
Source: Public Records
Tax History
| Year | Tax Paid | Tax Assessment Tax Assessment Total Assessment is a certain percentage of the fair market value that is determined by local assessors to be the total taxable value of land and additions on the property. | Land | Improvement |
|---|---|---|---|---|
| 2026 | $786 | $56,918 | $36,540 | $20,378 |
| 2024 | $1,022 | $54,812 | $34,755 | $20,057 |
| 2023 | $993 | $53,469 | $34,930 | $18,539 |
| 2022 | $1,011 | $43,567 | $28,455 | $15,112 |
| 2021 | $936 | $34,391 | $19,635 | $14,756 |
| 2020 | $907 | $32,381 | $17,850 | $14,531 |
| 2019 | $864 | $32,510 | $18,725 | $13,785 |
| 2018 | $840 | $26,782 | $13,545 | $13,237 |
| 2017 | $816 | $25,107 | $12,075 | $13,032 |
| 2016 | $795 | $25,339 | $11,550 | $13,789 |
| 2015 | $793 | $23,805 | $9,415 | $14,390 |
| 2014 | $770 | $22,327 | $7,980 | $14,347 |
| 2013 | -- | $20,563 | $5,985 | $14,578 |
Source: Public Records
Map
Nearby Homes
- 28 Arndell Way
- 8 E O St
- 115 P St
- 91 E York Way
- 14 E Greenbrae Dr
- 136 York Way Unit 1
- 343 Richards Way
- 1940 4th St Unit 20
- 1940 4th St Unit 51
- 1940 4th St Unit 46
- 355 York Way
- 1945 4th St Unit 22
- 1945 4th St Unit 51
- 314 M St
- 31 E L St
- 11 E J St
- 2455 Coppa Way
- 370 O'Brien Way
- 480 E Mclean Way
- 705 York Way
Your Personal Tour Guide
Ask me questions while you tour the home.