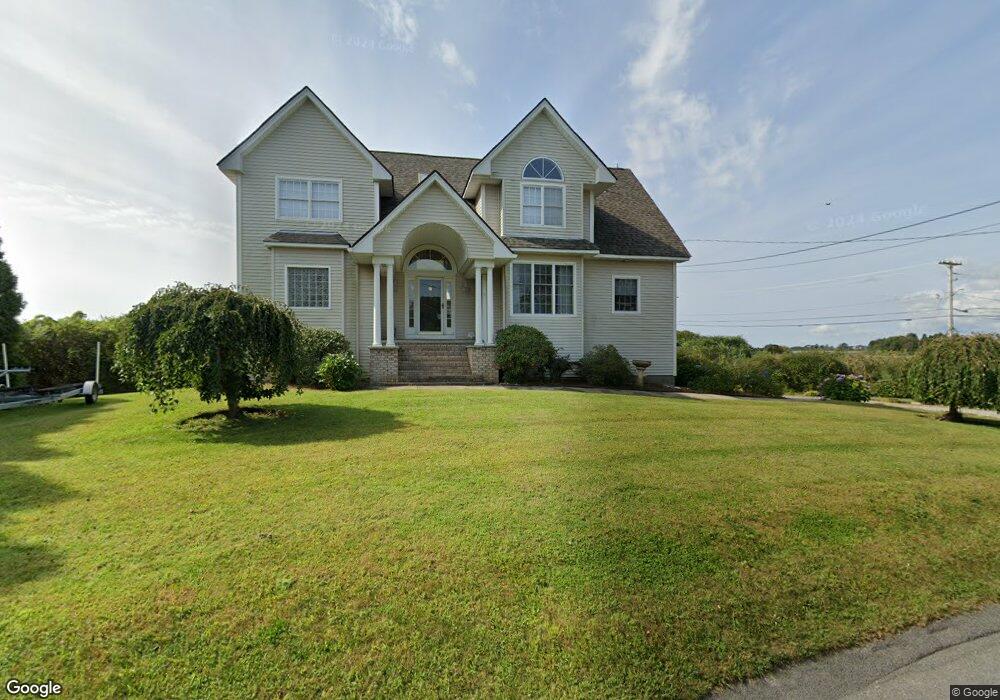
9 E Shore Rd Narragansett, RI 02882
Estimated Value: $2,138,000 - $2,705,000
3
Beds
3
Baths
2,501
Sq Ft
$930/Sq Ft
Est. Value
About This Home
This home is located at 9 E Shore Rd, Narragansett, RI 02882 and is currently estimated at $2,325,879, approximately $929 per square foot. 9 E Shore Rd is a home located in Washington County with nearby schools including Narragansett Elementary School, Narragansett Pier Middle School, and Narragansett High School.
Ownership History
Date
Name
Owned For
Owner Type
Purchase Details
Closed on
Dec 13, 2017
Sold by
Stevens Richard K and Stevens Sherry A
Bought by
Sherrys Place Llc
Current Estimated Value
Purchase Details
Closed on
Apr 30, 2004
Sold by
Wilcox Robert and Wilcox Patricia A
Bought by
Stevens Richard K and Stevens Sherry A
Home Financials for this Owner
Home Financials are based on the most recent Mortgage that was taken out on this home.
Original Mortgage
$315,000
Interest Rate
5.36%
Mortgage Type
Purchase Money Mortgage
Create a Home Valuation Report for This Property
The Home Valuation Report is an in-depth analysis detailing your home's value as well as a comparison with similar homes in the area
Home Values in the Area
Average Home Value in this Area
Purchase History
| Date | Buyer | Sale Price | Title Company |
|---|---|---|---|
| Sherrys Place Llc | -- | -- | |
| Stevens Richard K | $1,277,500 | -- |
Source: Public Records
Mortgage History
| Date | Status | Borrower | Loan Amount |
|---|---|---|---|
| Previous Owner | Stevens Richard K | $315,000 |
Source: Public Records
Tax History
| Year | Tax Paid | Tax Assessment Tax Assessment Total Assessment is a certain percentage of the fair market value that is determined by local assessors to be the total taxable value of land and additions on the property. | Land | Improvement |
|---|---|---|---|---|
| 2025 | $13,300 | $1,958,700 | $1,150,400 | $808,300 |
| 2024 | $12,829 | $1,958,700 | $1,150,400 | $808,300 |
| 2023 | $12,234 | $1,314,100 | $742,300 | $571,800 |
| 2022 | $11,827 | $1,314,100 | $742,300 | $571,800 |
| 2021 | $11,643 | $1,314,100 | $742,300 | $571,800 |
| 2020 | $10,244 | $977,500 | $575,800 | $401,700 |
| 2019 | $10,000 | $977,500 | $575,800 | $401,700 |
| 2018 | $9,726 | $977,500 | $575,800 | $401,700 |
| 2017 | $10,797 | $1,022,400 | $682,500 | $339,900 |
| 2016 | $10,306 | $1,022,400 | $682,500 | $339,900 |
| 2015 | $10,163 | $1,022,400 | $682,500 | $339,900 |
| 2014 | $9,471 | $943,300 | $622,300 | $321,000 |
Source: Public Records
Map
Nearby Homes
- 7 Conch Rd
- 271 G Great Island Rd
- 1185 Succotash Rd
- 1140 Succotash Rd
- 1138 Succotash Rd
- 6 MacAlder St
- 2 Sedge Ct
- 0 Barnacle Rd
- 0 Saltaire Ave
- 156 Saltaire Ave
- 0 Hemlock Ave
- 0 Point Judith Rd
- 31 Hemlock Ave
- 14 E Pointe Ct Unit 14
- 1125 Point Judith Rd Unit D5
- 17 Westside Rd
- 1048 Ocean Rd
- 60 Schooner Dr
- 8 Conant Ave
- 268 Foddering Farm Rd
Your Personal Tour Guide
Ask me questions while you tour the home.