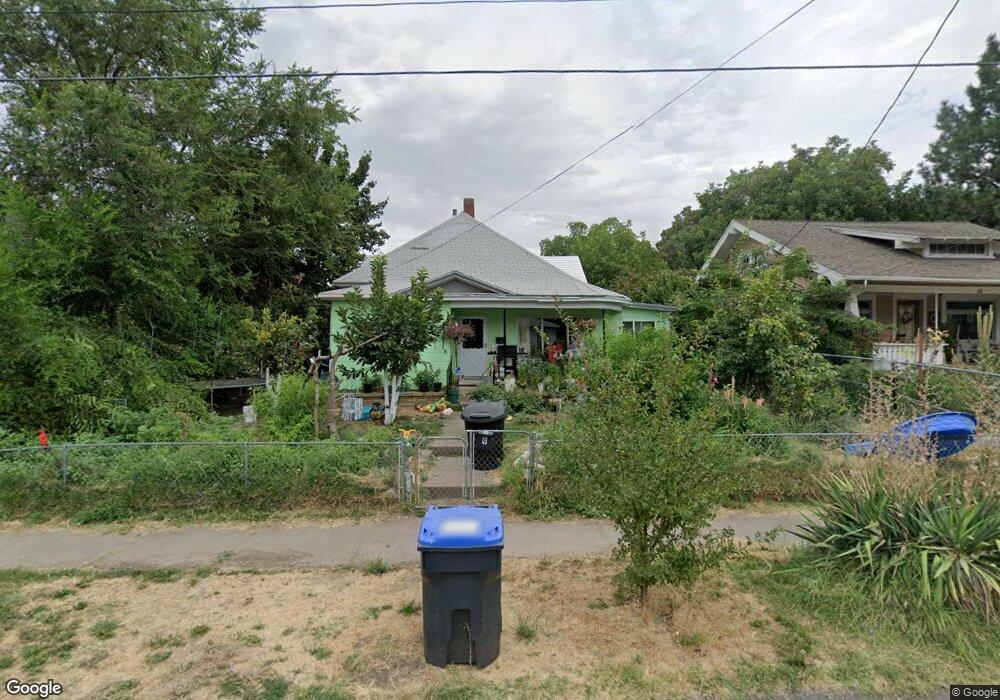
9 E Walnut St Walla Walla, WA 99362
Estimated Value: $301,000 - $468,000
4
Beds
2
Baths
1,837
Sq Ft
$193/Sq Ft
Est. Value
About This Home
This home is located at 9 E Walnut St, Walla Walla, WA 99362 and is currently estimated at $355,215, approximately $193 per square foot. 9 E Walnut St is a home located in Walla Walla County with nearby schools including Sharpstein Elementary School, Garrison Middle School, and Willow Public School.
Ownership History
Date
Name
Owned For
Owner Type
Purchase Details
Closed on
Nov 26, 2012
Sold by
Ellwein Barbara A
Bought by
Villagomez Ramon and Villagomez Sanjuana
Current Estimated Value
Home Financials for this Owner
Home Financials are based on the most recent Mortgage that was taken out on this home.
Original Mortgage
$102,116
Outstanding Balance
$69,736
Interest Rate
3.37%
Mortgage Type
FHA
Estimated Equity
$285,479
Purchase Details
Closed on
Dec 6, 2009
Sold by
Ellwein David H
Bought by
Ellwein Barbara A
Create a Home Valuation Report for This Property
The Home Valuation Report is an in-depth analysis detailing your home's value as well as a comparison with similar homes in the area
Purchase History
| Date | Buyer | Sale Price | Title Company |
|---|---|---|---|
| Villagomez Ramon | $104,000 | Land Title Of Walla Walla Co | |
| Ellwein Barbara A | -- | Land Title Of Walla Walla Co |
Source: Public Records
Mortgage History
| Date | Status | Borrower | Loan Amount |
|---|---|---|---|
| Open | Villagomez Ramon | $102,116 |
Source: Public Records
Tax History
| Year | Tax Paid | Tax Assessment Tax Assessment Total Assessment is a certain percentage of the fair market value that is determined by local assessors to be the total taxable value of land and additions on the property. | Land | Improvement |
|---|---|---|---|---|
| 2025 | $2,679 | $310,240 | $71,920 | $238,320 |
| 2024 | $2,350 | $270,520 | $71,920 | $198,600 |
| 2023 | $2,350 | $265,360 | $44,950 | $220,410 |
| 2022 | $2,296 | $245,320 | $44,950 | $200,370 |
| 2021 | $1,914 | $211,920 | $44,950 | $166,970 |
| 2020 | $1,892 | $160,100 | $44,950 | $115,150 |
| 2019 | $1,671 | $160,100 | $44,950 | $115,150 |
| 2018 | $1,553 | $154,620 | $44,950 | $109,670 |
| 2017 | $1,388 | $117,630 | $28,800 | $88,830 |
| 2016 | $1,459 | $113,400 | $28,800 | $84,600 |
| 2015 | $1,546 | $113,400 | $28,800 | $84,600 |
| 2014 | -- | $122,800 | $28,800 | $94,000 |
| 2013 | -- | $122,800 | $28,800 | $94,000 |
Source: Public Records
Map
Nearby Homes
Your Personal Tour Guide
Ask me questions while you tour the home.