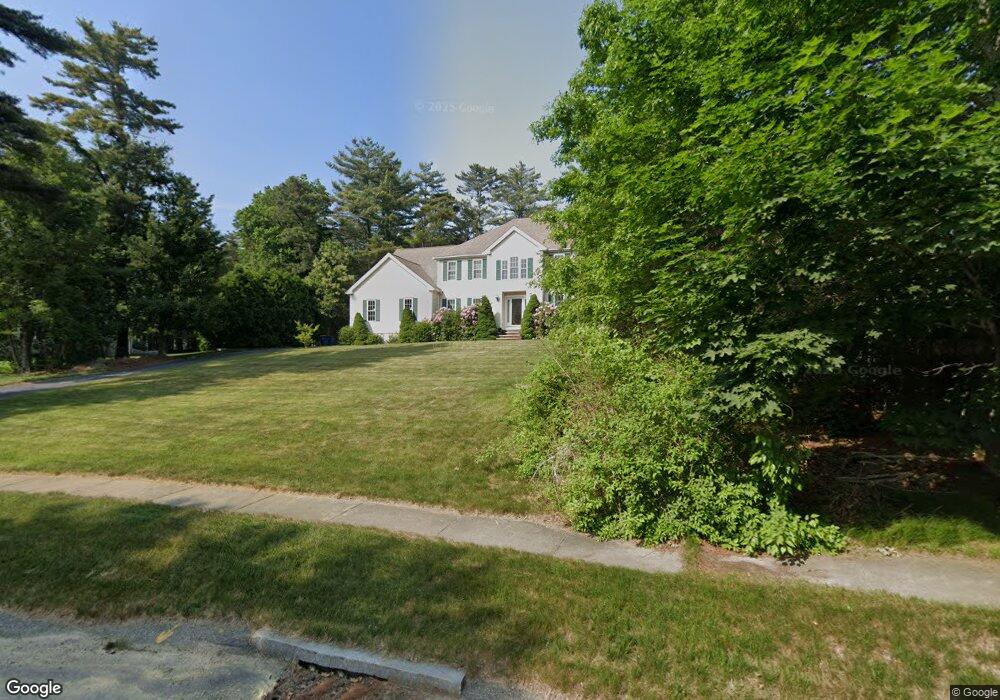
9 Eagle Dr Plymouth, MA 02360
Estimated Value: $857,991 - $932,000
4
Beds
3
Baths
2,884
Sq Ft
$307/Sq Ft
Est. Value
About This Home
This home is located at 9 Eagle Dr, Plymouth, MA 02360 and is currently estimated at $886,748, approximately $307 per square foot. 9 Eagle Dr is a home located in Plymouth County with nearby schools including Indian Brook, Plymouth South Middle School, and Plymouth South High School.
Ownership History
Date
Name
Owned For
Owner Type
Purchase Details
Closed on
Sep 28, 2001
Sold by
Jake Dev Llc and Treannie
Bought by
Pang Michael Z and Chen Qi
Current Estimated Value
Home Financials for this Owner
Home Financials are based on the most recent Mortgage that was taken out on this home.
Original Mortgage
$260,000
Interest Rate
6.91%
Mortgage Type
Purchase Money Mortgage
Create a Home Valuation Report for This Property
The Home Valuation Report is an in-depth analysis detailing your home's value as well as a comparison with similar homes in the area
Home Values in the Area
Average Home Value in this Area
Purchase History
| Date | Buyer | Sale Price | Title Company |
|---|---|---|---|
| Pang Michael Z | $350,000 | -- |
Source: Public Records
Mortgage History
| Date | Status | Borrower | Loan Amount |
|---|---|---|---|
| Open | Pang Michael Z | $185,000 | |
| Closed | Pang Michael Z | $75,000 | |
| Closed | Pang Michael Z | $220,000 | |
| Closed | Pang Michael Z | $260,000 |
Source: Public Records
Tax History Compared to Growth
Tax History
| Year | Tax Paid | Tax Assessment Tax Assessment Total Assessment is a certain percentage of the fair market value that is determined by local assessors to be the total taxable value of land and additions on the property. | Land | Improvement |
|---|---|---|---|---|
| 2025 | $10,227 | $805,900 | $217,400 | $588,500 |
| 2024 | $9,970 | $774,700 | $213,000 | $561,700 |
| 2023 | $9,512 | $693,800 | $186,600 | $507,200 |
| 2022 | $8,829 | $572,200 | $169,700 | $402,500 |
| 2021 | $8,851 | $547,700 | $169,700 | $378,000 |
| 2020 | $8,870 | $542,500 | $165,300 | $377,200 |
| 2019 | $8,740 | $528,400 | $147,700 | $380,700 |
| 2018 | $8,503 | $516,600 | $136,700 | $379,900 |
| 2017 | $8,348 | $503,500 | $160,700 | $342,800 |
| 2016 | $8,024 | $493,200 | $147,700 | $345,500 |
| 2015 | $7,706 | $495,900 | $147,700 | $348,200 |
| 2014 | $6,648 | $439,400 | $125,700 | $313,700 |
Source: Public Records
Map
Nearby Homes
- 375 Little Sandy Pond Rd
- 7 Central Ave
- 455 Lunns Way
- 4 Oriole Way
- 110 Valley Rd
- 215 Roxy Cahoon Rd
- 10 Shore Rd
- 28 Paulette Terrace
- 63 Pioneer Trail
- 520 Raymond Rd
- 9 Headlands Dr
- 7 Tadpole Way
- 65 Lakewood Dr
- 137 Sandy Beach Rd
- 4 Tadpole Way
- 12 Tradewind Ln
- 1 Kara's Way
- 150 Herring Pond Rd
- 44 Pisces Ln
- 12 Squirrel Rd
- 421 Little Sandy Pond Rd
- 11 Eagle Dr
- 10 Eagle Dr
- 10 Eagle Dr Unit SEACLIFF
- 415 Little Sandy Pond Rd
- 6 Eagle Dr
- 15 Eagle Dr
- 49 Copper Lantern Dr
- 55 Copper Lantern Dr
- 18 Eagle Dr
- 57 Copper Lantern Dr
- 59 Copper Lantern Dr
- 16 Eagle Dr
- 409 Little Sandy Pond Rd
- 45 Copper Lantern Dr
- 61 Copper Lantern Dr
- 57 Noreast Ln
- 430 Little Sandy Pond Rd
- 395 Little Sandy Pond Rd
- 30 Copper Lantern Dr