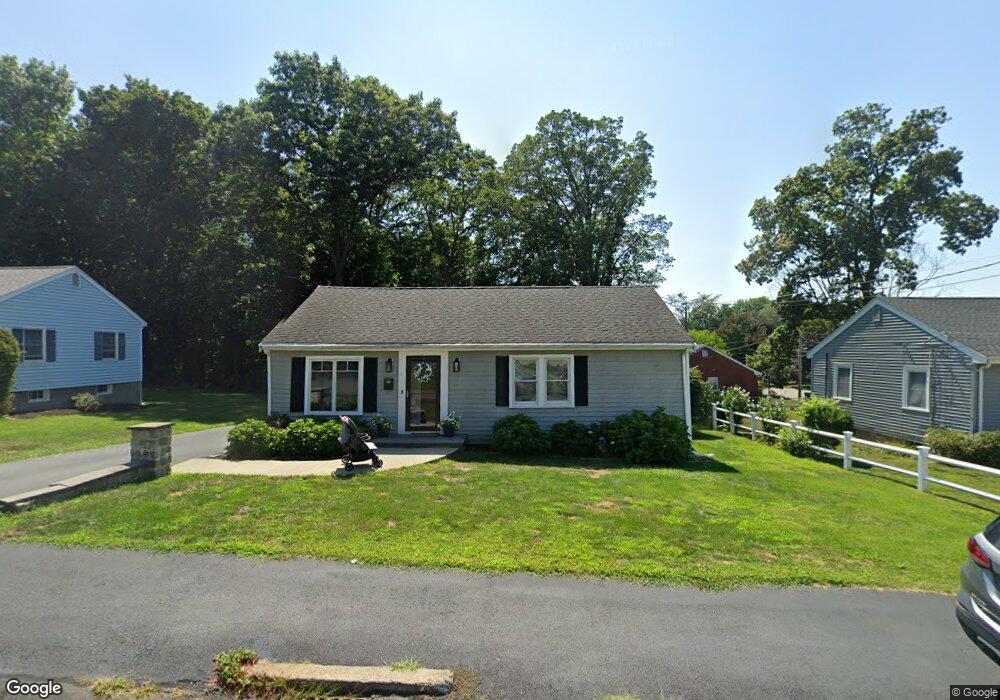
9 Edwards Rd Braintree, MA 02184
East Braintree NeighborhoodEstimated Value: $638,000 - $769,000
3
Beds
1
Bath
912
Sq Ft
$774/Sq Ft
Est. Value
About This Home
This home is located at 9 Edwards Rd, Braintree, MA 02184 and is currently estimated at $706,190, approximately $774 per square foot. 9 Edwards Rd is a home located in Norfolk County with nearby schools including Braintree High School, Meeting House Montessori School, and Step Ahead Kindergarten.
Ownership History
Date
Name
Owned For
Owner Type
Purchase Details
Closed on
Nov 1, 2024
Sold by
Gillis Michaela M
Bought by
Gillis Michaela M and Vonnak Bela
Current Estimated Value
Purchase Details
Closed on
Mar 30, 2005
Sold by
White Catherine G and White Todd S
Bought by
White Catherine G
Purchase Details
Closed on
Oct 1, 2003
Sold by
Dyer Jeffrey P and Dyer Kevin R
Bought by
White Todd S and White Catherine G
Purchase Details
Closed on
Feb 8, 2000
Sold by
Dyer Jeffrey P and Dyer Kevin R
Bought by
Dyer Jeffrey P and Dyer Kevin R
Create a Home Valuation Report for This Property
The Home Valuation Report is an in-depth analysis detailing your home's value as well as a comparison with similar homes in the area
Home Values in the Area
Average Home Value in this Area
Purchase History
| Date | Buyer | Sale Price | Title Company |
|---|---|---|---|
| Gillis Michaela M | -- | None Available | |
| Gillis Michaela M | -- | None Available | |
| White Catherine G | -- | -- | |
| White Catherine G | -- | -- | |
| White Todd S | $285,000 | -- | |
| White Catherine G | -- | -- | |
| White Todd S | $285,000 | -- | |
| Dyer Jeffrey P | $40,000 | -- |
Source: Public Records
Mortgage History
| Date | Status | Borrower | Loan Amount |
|---|---|---|---|
| Previous Owner | Dyer Jeffrey P | $318,500 | |
| Previous Owner | Dyer Jeffrey P | $320,000 |
Source: Public Records
Tax History
| Year | Tax Paid | Tax Assessment Tax Assessment Total Assessment is a certain percentage of the fair market value that is determined by local assessors to be the total taxable value of land and additions on the property. | Land | Improvement |
|---|---|---|---|---|
| 2025 | $5,768 | $578,000 | $342,800 | $235,200 |
| 2024 | $5,142 | $542,400 | $311,200 | $231,200 |
| 2023 | $4,854 | $497,300 | $279,600 | $217,700 |
| 2022 | $4,679 | $470,300 | $252,600 | $217,700 |
| 2021 | $4,303 | $432,500 | $228,200 | $204,300 |
| 2020 | $4,060 | $411,800 | $207,500 | $204,300 |
| 2019 | $3,833 | $379,900 | $198,400 | $181,500 |
| 2018 | $3,744 | $355,200 | $180,400 | $174,800 |
| 2017 | $3,718 | $346,200 | $171,400 | $174,800 |
| 2016 | $3,370 | $306,900 | $162,400 | $144,500 |
| 2015 | $3,097 | $279,800 | $135,300 | $144,500 |
| 2014 | $2,913 | $255,100 | $129,900 | $125,200 |
Source: Public Records
Map
Nearby Homes
- 17 White Rd
- 192 Federal Ave Unit B
- 9 Independence Ave Unit 307
- 342 Elm St
- 155 Kendrick Ave Unit 502
- 177 Franklin St
- 36 Independence Ave Unit 1
- 166 Phipps St
- 30 Church St Unit 4
- 50 N Payne St Unit 6
- 87 Franklin St Unit 105
- 347 Centre St
- 126 Water St
- 21 Totman St Unit 308
- 21 Totman St Unit 205
- 21 Totman St Unit 404
- 21 Totman St Unit 309
- 21 Totman St Unit 203
- 21 Totman St Unit PH-406
- 21 Totman St Unit 408
Your Personal Tour Guide
Ask me questions while you tour the home.