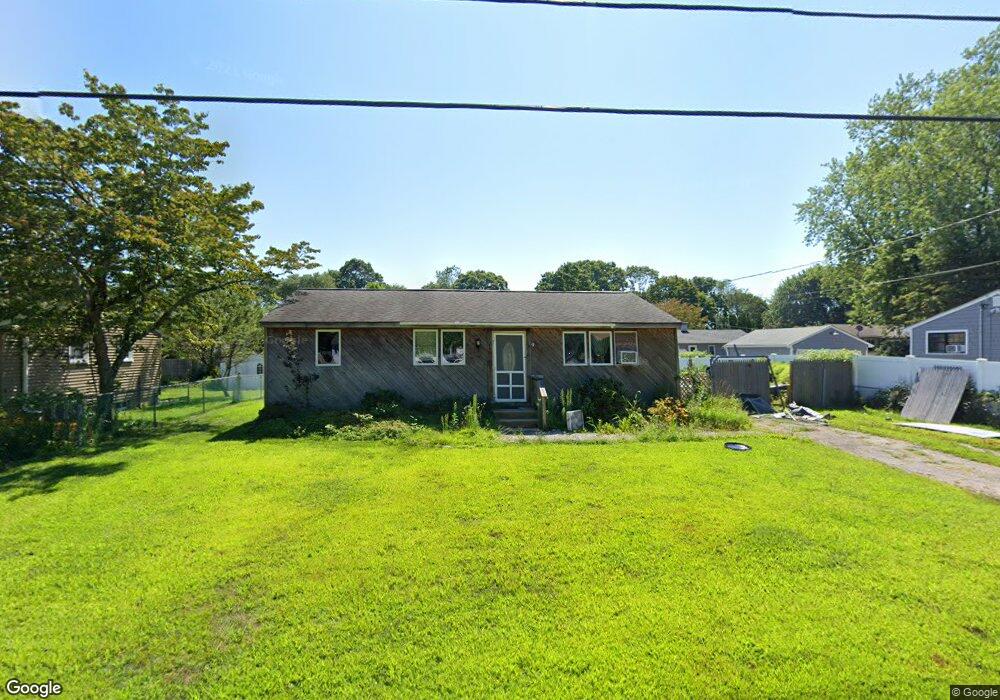
9 Edwards Rd Old Saybrook, CT 06475
Estimated Value: $508,000 - $685,000
3
Beds
3
Baths
936
Sq Ft
$639/Sq Ft
Est. Value
About This Home
This home is located at 9 Edwards Rd, Old Saybrook, CT 06475 and is currently estimated at $597,849, approximately $638 per square foot. 9 Edwards Rd is a home located in Middlesex County with nearby schools including Kathleen E. Goodwin School, Old Saybrook Middle School, and Old Saybrook Senior High School.
Ownership History
Date
Name
Owned For
Owner Type
Purchase Details
Closed on
Dec 13, 2019
Sold by
Saunders Frank
Bought by
Garolfalo Sebastian L
Current Estimated Value
Purchase Details
Closed on
Jan 12, 2006
Sold by
Derenthal Stephen
Bought by
Saunders Frank
Home Financials for this Owner
Home Financials are based on the most recent Mortgage that was taken out on this home.
Original Mortgage
$174,000
Interest Rate
7.75%
Create a Home Valuation Report for This Property
The Home Valuation Report is an in-depth analysis detailing your home's value as well as a comparison with similar homes in the area
Home Values in the Area
Average Home Value in this Area
Purchase History
| Date | Buyer | Sale Price | Title Company |
|---|---|---|---|
| Garolfalo Sebastian L | $210,000 | None Available | |
| Saunders Frank | $165,000 | -- |
Source: Public Records
Mortgage History
| Date | Status | Borrower | Loan Amount |
|---|---|---|---|
| Previous Owner | Saunders Frank | $207,700 | |
| Previous Owner | Saunders Frank | $207,000 | |
| Previous Owner | Saunders Frank | $174,000 |
Source: Public Records
Tax History Compared to Growth
Tax History
| Year | Tax Paid | Tax Assessment Tax Assessment Total Assessment is a certain percentage of the fair market value that is determined by local assessors to be the total taxable value of land and additions on the property. | Land | Improvement |
|---|---|---|---|---|
| 2025 | $4,072 | $262,700 | $103,000 | $159,700 |
| 2024 | $3,993 | $262,700 | $103,000 | $159,700 |
| 2023 | $3,481 | $170,200 | $60,200 | $110,000 |
| 2022 | $3,418 | $170,200 | $60,200 | $110,000 |
| 2021 | $2,911 | $145,200 | $60,200 | $85,000 |
| 2020 | $2,871 | $143,200 | $60,200 | $83,000 |
| 2019 | $2,828 | $143,200 | $60,200 | $83,000 |
| 2018 | $2,671 | $136,300 | $56,200 | $80,100 |
| 2017 | $2,680 | $136,300 | $56,200 | $80,100 |
| 2016 | $2,625 | $136,300 | $56,200 | $80,100 |
| 2015 | $2,564 | $136,300 | $56,200 | $80,100 |
| 2014 | $2,505 | $135,400 | $56,200 | $79,200 |
Source: Public Records
Map
Nearby Homes