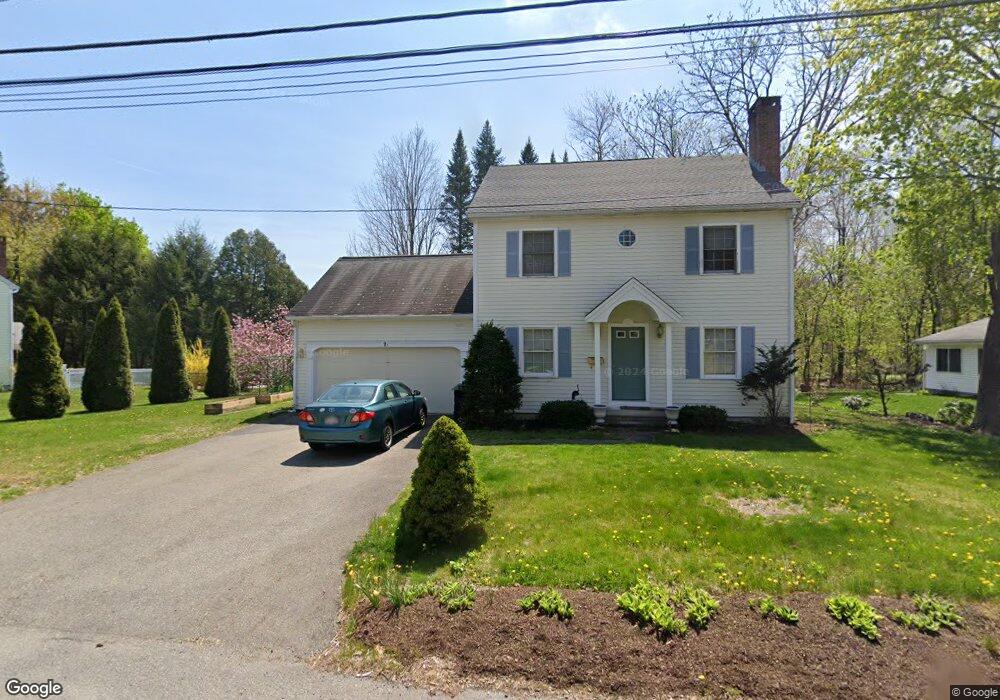
9 Elm Ct Maynard, MA 01754
Estimated Value: $647,000 - $747,000
3
Beds
3
Baths
1,602
Sq Ft
$435/Sq Ft
Est. Value
About This Home
This home is located at 9 Elm Ct, Maynard, MA 01754 and is currently estimated at $696,968, approximately $435 per square foot. 9 Elm Ct is a home located in Middlesex County with nearby schools including Green Meadow School, Fowler School, and Maynard High School.
Ownership History
Date
Name
Owned For
Owner Type
Purchase Details
Closed on
Dec 1, 2010
Sold by
Plouffe Francis A and Plouffe Gerene S
Bought by
Roy Thomas R and Boettcher Bonniejean
Current Estimated Value
Home Financials for this Owner
Home Financials are based on the most recent Mortgage that was taken out on this home.
Original Mortgage
$291,456
Outstanding Balance
$190,297
Interest Rate
4.22%
Mortgage Type
Purchase Money Mortgage
Estimated Equity
$506,671
Purchase Details
Closed on
Jul 18, 1996
Sold by
Maillet & Son Inc
Bought by
Plouffe Francis A and Plouffe Gerene S
Create a Home Valuation Report for This Property
The Home Valuation Report is an in-depth analysis detailing your home's value as well as a comparison with similar homes in the area
Home Values in the Area
Average Home Value in this Area
Purchase History
| Date | Buyer | Sale Price | Title Company |
|---|---|---|---|
| Roy Thomas R | $340,000 | -- | |
| Plouffe Francis A | $177,000 | -- |
Source: Public Records
Mortgage History
| Date | Status | Borrower | Loan Amount |
|---|---|---|---|
| Open | Roy Thomas R | $291,456 |
Source: Public Records
Tax History
| Year | Tax Paid | Tax Assessment Tax Assessment Total Assessment is a certain percentage of the fair market value that is determined by local assessors to be the total taxable value of land and additions on the property. | Land | Improvement |
|---|---|---|---|---|
| 2025 | $10,423 | $584,600 | $276,400 | $308,200 |
| 2024 | $9,845 | $550,600 | $263,200 | $287,400 |
| 2023 | $9,623 | $507,300 | $250,700 | $256,600 |
| 2022 | $9,053 | $441,200 | $210,600 | $230,600 |
| 2021 | $8,757 | $434,600 | $210,600 | $224,000 |
| 2020 | $8,692 | $421,100 | $190,500 | $230,600 |
| 2019 | $8,361 | $397,400 | $182,000 | $215,400 |
| 2018 | $8,359 | $369,200 | $165,400 | $203,800 |
| 2017 | $8,126 | $369,200 | $165,400 | $203,800 |
| 2016 | $7,846 | $369,200 | $165,400 | $203,800 |
| 2015 | $7,507 | $336,500 | $157,900 | $178,600 |
| 2014 | $7,309 | $327,900 | $152,900 | $175,000 |
Source: Public Records
Map
Nearby Homes
- 36 Brown St
- 12 Brown St
- 63 Conant St
- 153 Summer St
- 66 Powder Mill Rd
- 68 Powder Mill Rd
- 70 Powder Mill Rd
- 22 Douglas Ave Unit 2
- 22 Douglas Ave Unit 1
- 10 Mill St Unit B
- 13 Arthur St Unit 15
- 5 Hayes St Unit 5
- 31-33 Roosevelt St
- 23 Deer Path Unit 5
- 41 Taylor Rd
- 40 High St
- 30 Brewster Ln
- 1 Drummer Rd Unit A5
- 131 Main St
- 129 Main St Unit 129
Your Personal Tour Guide
Ask me questions while you tour the home.